Asian vs Bermudan In Labor Force | Age 20-24
COMPARE
Asian
Bermudan
In Labor Force | Age 20-24
In Labor Force | Age 20-24 Comparison
Asians
Bermudans
73.7%
IN LABOR FORCE | AGE 20-24
0.6/ 100
METRIC RATING
262nd/ 347
METRIC RANK
74.1%
IN LABOR FORCE | AGE 20-24
3.2/ 100
METRIC RATING
237th/ 347
METRIC RANK
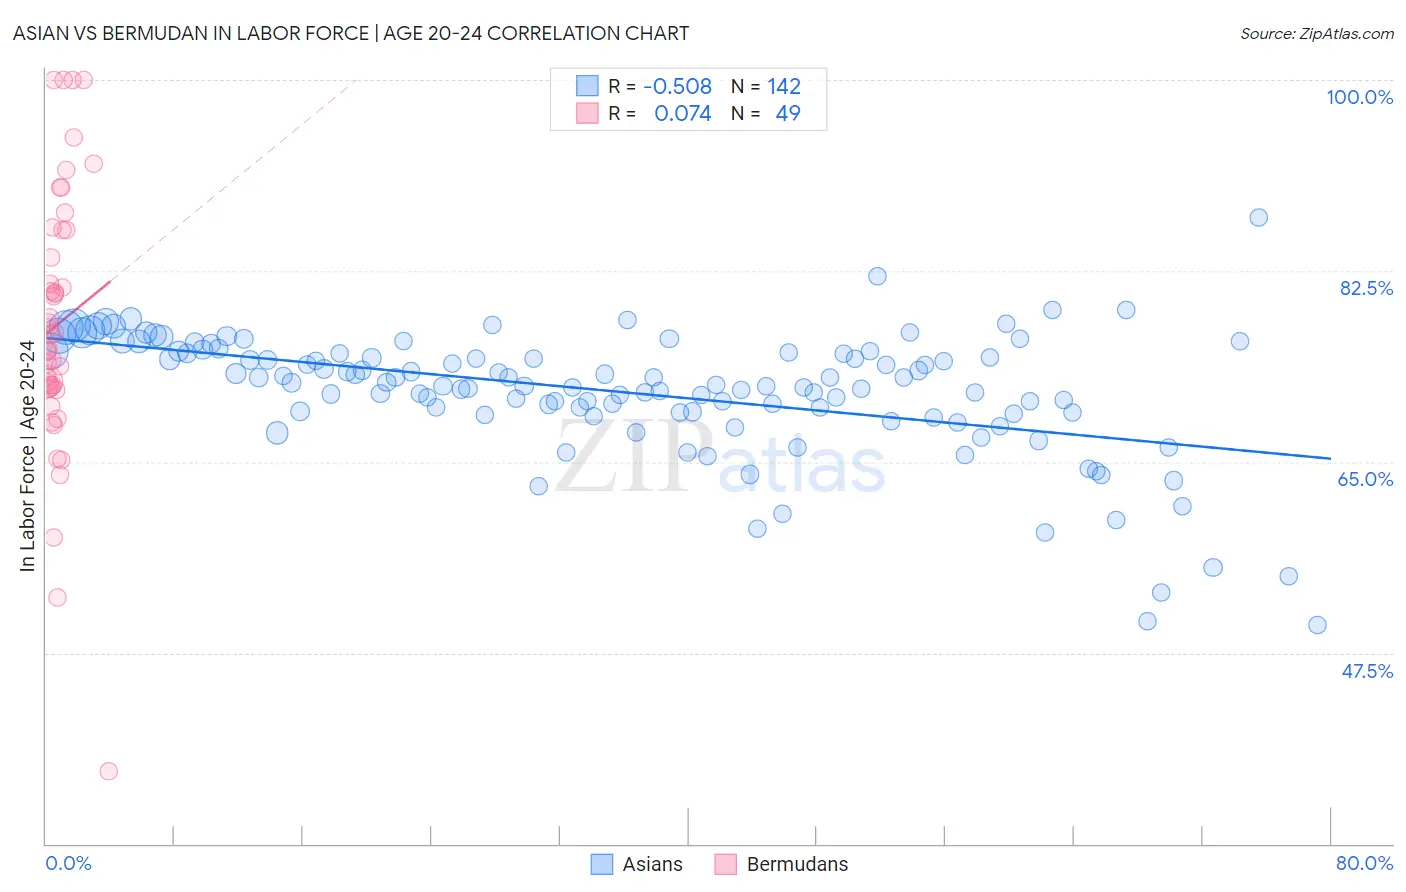
Asian vs Bermudan In Labor Force | Age 20-24 Correlation Chart
The statistical analysis conducted on geographies consisting of 550,133,800 people shows a substantial negative correlation between the proportion of Asians and labor force participation rate among population between the ages 20 and 24 in the United States with a correlation coefficient (R) of -0.508 and weighted average of 73.7%. Similarly, the statistical analysis conducted on geographies consisting of 55,728,431 people shows a slight positive correlation between the proportion of Bermudans and labor force participation rate among population between the ages 20 and 24 in the United States with a correlation coefficient (R) of 0.074 and weighted average of 74.1%, a difference of 0.63%.
In Labor Force | Age 20-24 Correlation Summary
| Measurement | Asian | Bermudan |
| Minimum | 50.0% | 36.7% |
| Maximum | 87.4% | 100.0% |
| Range | 37.4% | 63.3% |
| Mean | 71.4% | 77.6% |
| Median | 72.2% | 76.7% |
| Interquartile 25% (IQ1) | 69.5% | 71.8% |
| Interquartile 75% (IQ3) | 75.0% | 86.2% |
| Interquartile Range (IQR) | 5.5% | 14.4% |
| Standard Deviation (Sample) | 5.8% | 12.3% |
| Standard Deviation (Population) | 5.8% | 12.1% |
Similar Demographics by In Labor Force | Age 20-24
Demographics Similar to Asians by In Labor Force | Age 20-24
In terms of in labor force | age 20-24, the demographic groups most similar to Asians are Houma (73.7%, a difference of 0.010%), Immigrants from Turkey (73.7%, a difference of 0.020%), Egyptian (73.7%, a difference of 0.050%), Dutch West Indian (73.7%, a difference of 0.050%), and Immigrants from Asia (73.6%, a difference of 0.080%).
| Demographics | Rating | Rank | In Labor Force | Age 20-24 |
| Immigrants | Pakistan | 0.9 /100 | #255 | Tragic 73.8% |
| Spanish American Indians | 0.8 /100 | #256 | Tragic 73.7% |
| Paraguayans | 0.8 /100 | #257 | Tragic 73.7% |
| Egyptians | 0.7 /100 | #258 | Tragic 73.7% |
| Dutch West Indians | 0.7 /100 | #259 | Tragic 73.7% |
| Immigrants | Turkey | 0.7 /100 | #260 | Tragic 73.7% |
| Houma | 0.6 /100 | #261 | Tragic 73.7% |
| Asians | 0.6 /100 | #262 | Tragic 73.7% |
| Immigrants | Asia | 0.5 /100 | #263 | Tragic 73.6% |
| Immigrants | Haiti | 0.5 /100 | #264 | Tragic 73.6% |
| Burmese | 0.5 /100 | #265 | Tragic 73.6% |
| Haitians | 0.5 /100 | #266 | Tragic 73.6% |
| Immigrants | Western Asia | 0.4 /100 | #267 | Tragic 73.5% |
| South Americans | 0.4 /100 | #268 | Tragic 73.5% |
| Colombians | 0.3 /100 | #269 | Tragic 73.5% |
Demographics Similar to Bermudans by In Labor Force | Age 20-24
In terms of in labor force | age 20-24, the demographic groups most similar to Bermudans are Immigrants from France (74.1%, a difference of 0.010%), Laotian (74.1%, a difference of 0.030%), Immigrants from Japan (74.1%, a difference of 0.030%), Immigrants (74.1%, a difference of 0.040%), and Immigrants from Chile (74.1%, a difference of 0.050%).
| Demographics | Rating | Rank | In Labor Force | Age 20-24 |
| Immigrants | Albania | 4.3 /100 | #230 | Tragic 74.2% |
| Immigrants | Greece | 4.1 /100 | #231 | Tragic 74.2% |
| Immigrants | Switzerland | 4.1 /100 | #232 | Tragic 74.2% |
| Immigrants | Chile | 3.7 /100 | #233 | Tragic 74.1% |
| Immigrants | Immigrants | 3.6 /100 | #234 | Tragic 74.1% |
| Laotians | 3.5 /100 | #235 | Tragic 74.1% |
| Immigrants | France | 3.3 /100 | #236 | Tragic 74.1% |
| Bermudans | 3.2 /100 | #237 | Tragic 74.1% |
| Immigrants | Japan | 3.0 /100 | #238 | Tragic 74.1% |
| Immigrants | Latin America | 2.7 /100 | #239 | Tragic 74.1% |
| Immigrants | Sri Lanka | 2.3 /100 | #240 | Tragic 74.0% |
| Immigrants | Senegal | 2.1 /100 | #241 | Tragic 74.0% |
| Thais | 2.1 /100 | #242 | Tragic 74.0% |
| Immigrants | Syria | 1.9 /100 | #243 | Tragic 74.0% |
| Immigrants | South Central Asia | 1.9 /100 | #244 | Tragic 74.0% |