Immigrants from Nigeria vs Kiowa In Labor Force | Age 20-24
COMPARE
Immigrants from Nigeria
Kiowa
In Labor Force | Age 20-24
In Labor Force | Age 20-24 Comparison
Immigrants from Nigeria
Kiowa
74.7%
IN LABOR FORCE | AGE 20-24
24.2/ 100
METRIC RATING
198th/ 347
METRIC RANK
73.2%
IN LABOR FORCE | AGE 20-24
0.1/ 100
METRIC RATING
284th/ 347
METRIC RANK
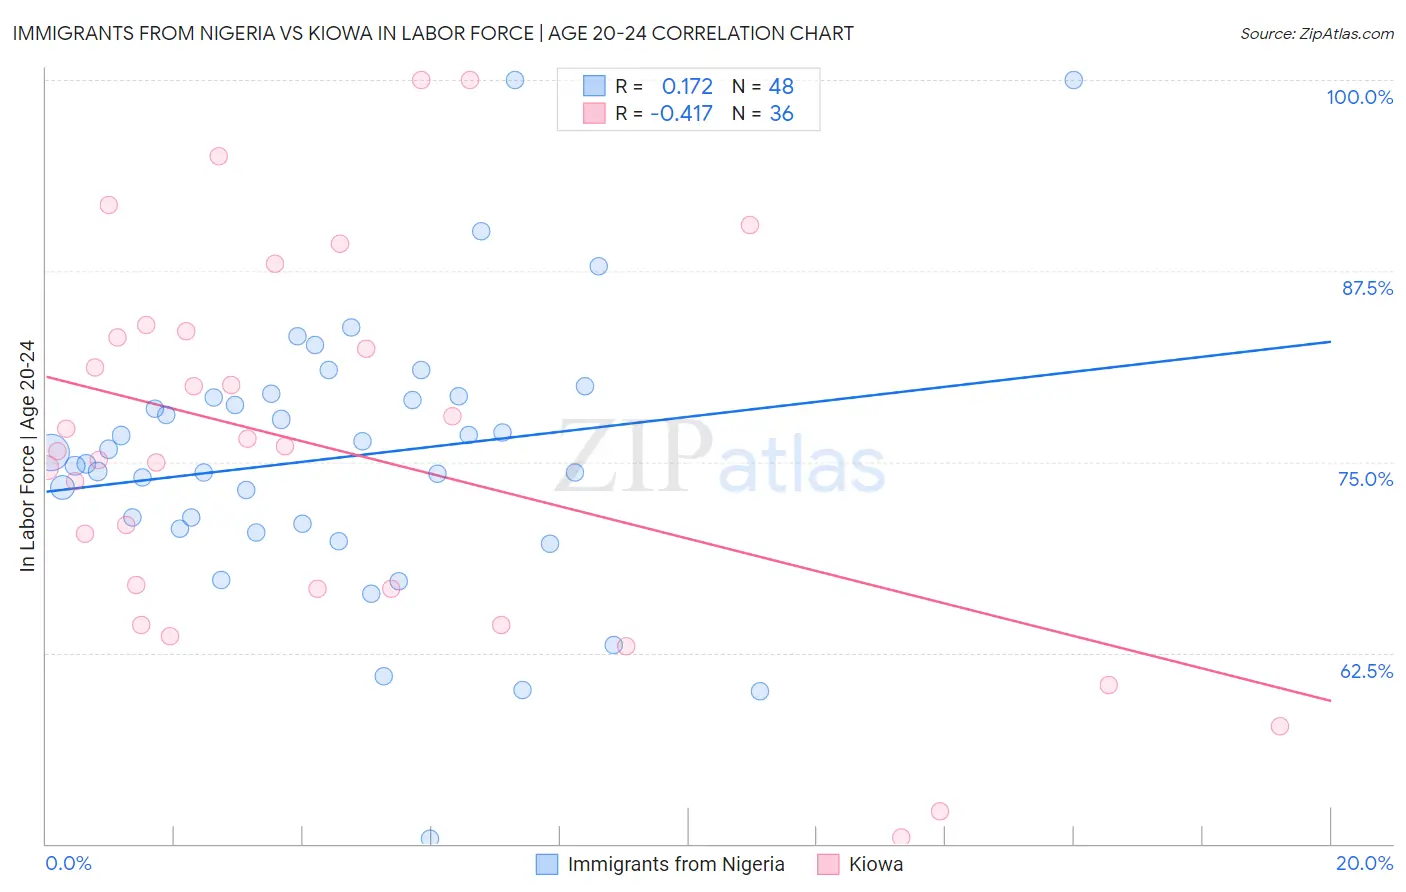
Immigrants from Nigeria vs Kiowa In Labor Force | Age 20-24 Correlation Chart
The statistical analysis conducted on geographies consisting of 283,465,433 people shows a poor positive correlation between the proportion of Immigrants from Nigeria and labor force participation rate among population between the ages 20 and 24 in the United States with a correlation coefficient (R) of 0.172 and weighted average of 74.7%. Similarly, the statistical analysis conducted on geographies consisting of 56,096,922 people shows a moderate negative correlation between the proportion of Kiowa and labor force participation rate among population between the ages 20 and 24 in the United States with a correlation coefficient (R) of -0.417 and weighted average of 73.2%, a difference of 2.1%.
In Labor Force | Age 20-24 Correlation Summary
| Measurement | Immigrants from Nigeria | Kiowa |
| Minimum | 50.3% | 50.4% |
| Maximum | 100.0% | 100.0% |
| Range | 49.7% | 49.6% |
| Mean | 75.3% | 75.8% |
| Median | 75.2% | 75.9% |
| Interquartile 25% (IQ1) | 70.8% | 66.7% |
| Interquartile 75% (IQ3) | 79.3% | 83.3% |
| Interquartile Range (IQR) | 8.5% | 16.6% |
| Standard Deviation (Sample) | 9.0% | 12.3% |
| Standard Deviation (Population) | 8.9% | 12.1% |
Similar Demographics by In Labor Force | Age 20-24
Demographics Similar to Immigrants from Nigeria by In Labor Force | Age 20-24
In terms of in labor force | age 20-24, the demographic groups most similar to Immigrants from Nigeria are Eastern European (74.8%, a difference of 0.020%), Immigrants from Vietnam (74.7%, a difference of 0.020%), Panamanian (74.7%, a difference of 0.020%), Taiwanese (74.7%, a difference of 0.020%), and Immigrants from Denmark (74.8%, a difference of 0.030%).
| Demographics | Rating | Rank | In Labor Force | Age 20-24 |
| Senegalese | 28.1 /100 | #191 | Fair 74.8% |
| Immigrants | Europe | 27.5 /100 | #192 | Fair 74.8% |
| Alsatians | 27.1 /100 | #193 | Fair 74.8% |
| Immigrants | Denmark | 25.8 /100 | #194 | Fair 74.8% |
| Eastern Europeans | 25.4 /100 | #195 | Fair 74.8% |
| Immigrants | Vietnam | 25.1 /100 | #196 | Fair 74.7% |
| Panamanians | 25.0 /100 | #197 | Fair 74.7% |
| Immigrants | Nigeria | 24.2 /100 | #198 | Fair 74.7% |
| Taiwanese | 23.2 /100 | #199 | Fair 74.7% |
| Nigerians | 21.9 /100 | #200 | Fair 74.7% |
| Choctaw | 21.4 /100 | #201 | Fair 74.7% |
| Moroccans | 20.4 /100 | #202 | Fair 74.7% |
| Immigrants | Northern Africa | 17.9 /100 | #203 | Poor 74.6% |
| Immigrants | Italy | 17.6 /100 | #204 | Poor 74.6% |
| Inupiat | 17.6 /100 | #205 | Poor 74.6% |
Demographics Similar to Kiowa by In Labor Force | Age 20-24
In terms of in labor force | age 20-24, the demographic groups most similar to Kiowa are Immigrants from Bahamas (73.2%, a difference of 0.020%), Immigrants from Spain (73.2%, a difference of 0.030%), Immigrants from Venezuela (73.2%, a difference of 0.040%), Nicaraguan (73.2%, a difference of 0.060%), and Bahamian (73.3%, a difference of 0.070%).
| Demographics | Rating | Rank | In Labor Force | Age 20-24 |
| Immigrants | Malaysia | 0.2 /100 | #277 | Tragic 73.3% |
| Cypriots | 0.2 /100 | #278 | Tragic 73.3% |
| Venezuelans | 0.2 /100 | #279 | Tragic 73.3% |
| Bahamians | 0.1 /100 | #280 | Tragic 73.3% |
| Immigrants | Venezuela | 0.1 /100 | #281 | Tragic 73.2% |
| Immigrants | Spain | 0.1 /100 | #282 | Tragic 73.2% |
| Immigrants | Bahamas | 0.1 /100 | #283 | Tragic 73.2% |
| Kiowa | 0.1 /100 | #284 | Tragic 73.2% |
| Nicaraguans | 0.1 /100 | #285 | Tragic 73.2% |
| Immigrants | Lebanon | 0.1 /100 | #286 | Tragic 73.1% |
| Immigrants | Korea | 0.1 /100 | #287 | Tragic 73.1% |
| Argentineans | 0.1 /100 | #288 | Tragic 73.1% |
| U.S. Virgin Islanders | 0.1 /100 | #289 | Tragic 73.0% |
| Immigrants | Belarus | 0.1 /100 | #290 | Tragic 73.0% |
| Immigrants | Nicaragua | 0.0 /100 | #291 | Tragic 72.9% |