Immigrants from Nigeria vs Assyrian/Chaldean/Syriac In Labor Force | Age 20-24
COMPARE
Immigrants from Nigeria
Assyrian/Chaldean/Syriac
In Labor Force | Age 20-24
In Labor Force | Age 20-24 Comparison
Immigrants from Nigeria
Assyrians/Chaldeans/Syriacs
74.7%
IN LABOR FORCE | AGE 20-24
24.2/ 100
METRIC RATING
198th/ 347
METRIC RANK
75.9%
IN LABOR FORCE | AGE 20-24
94.9/ 100
METRIC RATING
117th/ 347
METRIC RANK
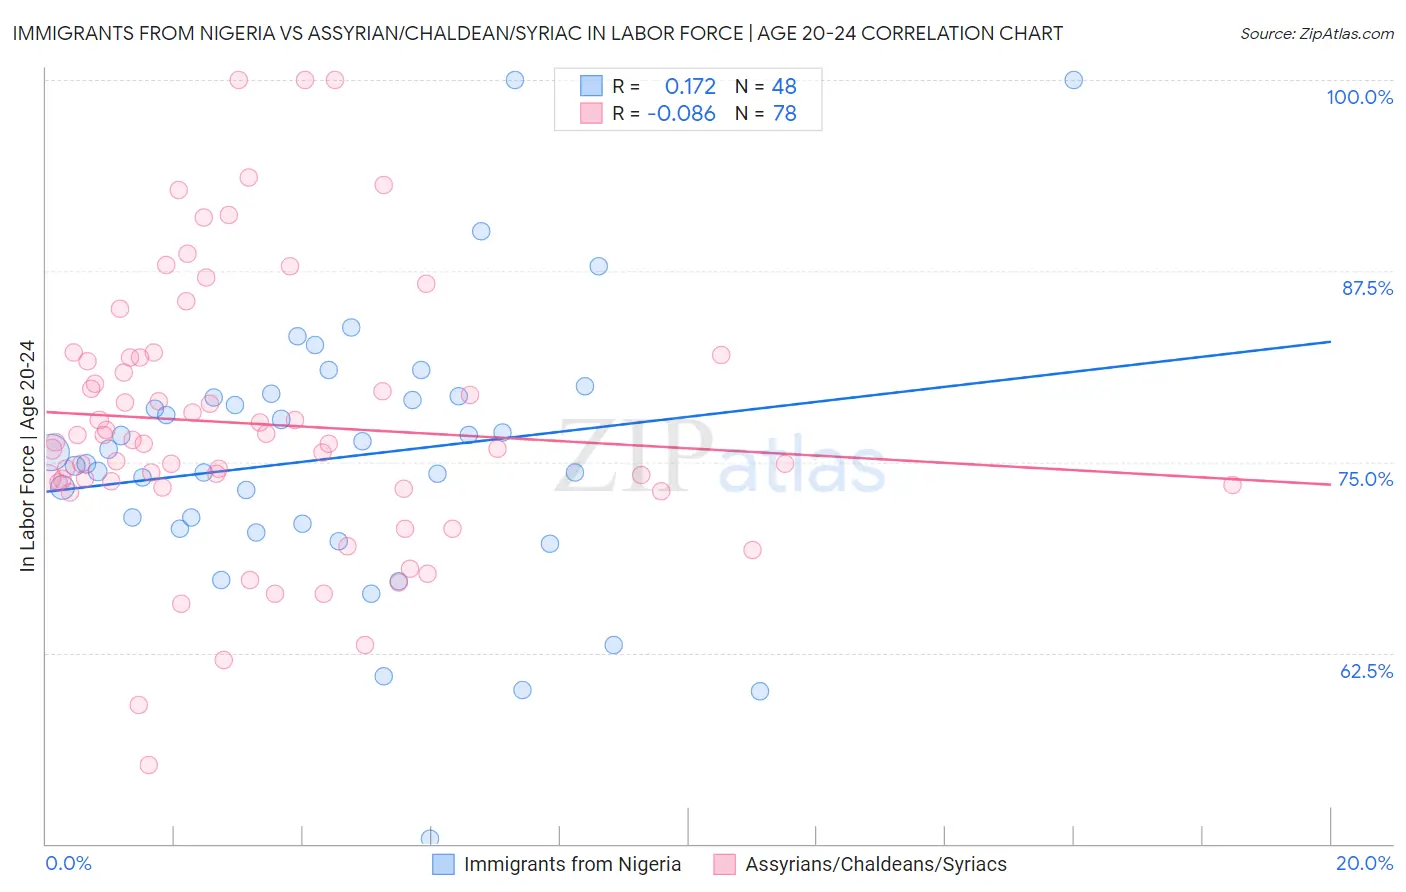
Immigrants from Nigeria vs Assyrian/Chaldean/Syriac In Labor Force | Age 20-24 Correlation Chart
The statistical analysis conducted on geographies consisting of 283,465,433 people shows a poor positive correlation between the proportion of Immigrants from Nigeria and labor force participation rate among population between the ages 20 and 24 in the United States with a correlation coefficient (R) of 0.172 and weighted average of 74.7%. Similarly, the statistical analysis conducted on geographies consisting of 110,301,769 people shows a slight negative correlation between the proportion of Assyrians/Chaldeans/Syriacs and labor force participation rate among population between the ages 20 and 24 in the United States with a correlation coefficient (R) of -0.086 and weighted average of 75.9%, a difference of 1.5%.
In Labor Force | Age 20-24 Correlation Summary
| Measurement | Immigrants from Nigeria | Assyrian/Chaldean/Syriac |
| Minimum | 50.3% | 55.2% |
| Maximum | 100.0% | 100.0% |
| Range | 49.7% | 44.8% |
| Mean | 75.3% | 77.5% |
| Median | 75.2% | 76.3% |
| Interquartile 25% (IQ1) | 70.8% | 73.5% |
| Interquartile 75% (IQ3) | 79.3% | 81.9% |
| Interquartile Range (IQR) | 8.5% | 8.4% |
| Standard Deviation (Sample) | 9.0% | 8.8% |
| Standard Deviation (Population) | 8.9% | 8.7% |
Similar Demographics by In Labor Force | Age 20-24
Demographics Similar to Immigrants from Nigeria by In Labor Force | Age 20-24
In terms of in labor force | age 20-24, the demographic groups most similar to Immigrants from Nigeria are Eastern European (74.8%, a difference of 0.020%), Immigrants from Vietnam (74.7%, a difference of 0.020%), Panamanian (74.7%, a difference of 0.020%), Taiwanese (74.7%, a difference of 0.020%), and Immigrants from Denmark (74.8%, a difference of 0.030%).
| Demographics | Rating | Rank | In Labor Force | Age 20-24 |
| Senegalese | 28.1 /100 | #191 | Fair 74.8% |
| Immigrants | Europe | 27.5 /100 | #192 | Fair 74.8% |
| Alsatians | 27.1 /100 | #193 | Fair 74.8% |
| Immigrants | Denmark | 25.8 /100 | #194 | Fair 74.8% |
| Eastern Europeans | 25.4 /100 | #195 | Fair 74.8% |
| Immigrants | Vietnam | 25.1 /100 | #196 | Fair 74.7% |
| Panamanians | 25.0 /100 | #197 | Fair 74.7% |
| Immigrants | Nigeria | 24.2 /100 | #198 | Fair 74.7% |
| Taiwanese | 23.2 /100 | #199 | Fair 74.7% |
| Nigerians | 21.9 /100 | #200 | Fair 74.7% |
| Choctaw | 21.4 /100 | #201 | Fair 74.7% |
| Moroccans | 20.4 /100 | #202 | Fair 74.7% |
| Immigrants | Northern Africa | 17.9 /100 | #203 | Poor 74.6% |
| Immigrants | Italy | 17.6 /100 | #204 | Poor 74.6% |
| Inupiat | 17.6 /100 | #205 | Poor 74.6% |
Demographics Similar to Assyrians/Chaldeans/Syriacs by In Labor Force | Age 20-24
In terms of in labor force | age 20-24, the demographic groups most similar to Assyrians/Chaldeans/Syriacs are Alaska Native (75.9%, a difference of 0.010%), Immigrants from North America (75.9%, a difference of 0.010%), Spanish American (75.8%, a difference of 0.010%), Immigrants from Portugal (75.8%, a difference of 0.010%), and Immigrants from Zimbabwe (75.9%, a difference of 0.020%).
| Demographics | Rating | Rank | In Labor Force | Age 20-24 |
| Immigrants | Morocco | 95.8 /100 | #110 | Exceptional 75.9% |
| Ukrainians | 95.7 /100 | #111 | Exceptional 75.9% |
| Immigrants | Canada | 95.6 /100 | #112 | Exceptional 75.9% |
| Immigrants | Netherlands | 95.3 /100 | #113 | Exceptional 75.9% |
| Immigrants | Zimbabwe | 95.1 /100 | #114 | Exceptional 75.9% |
| Alaska Natives | 95.1 /100 | #115 | Exceptional 75.9% |
| Immigrants | North America | 95.0 /100 | #116 | Exceptional 75.9% |
| Assyrians/Chaldeans/Syriacs | 94.9 /100 | #117 | Exceptional 75.9% |
| Spanish Americans | 94.8 /100 | #118 | Exceptional 75.8% |
| Immigrants | Portugal | 94.8 /100 | #119 | Exceptional 75.8% |
| Immigrants | Africa | 94.6 /100 | #120 | Exceptional 75.8% |
| Immigrants | Serbia | 94.3 /100 | #121 | Exceptional 75.8% |
| Pakistanis | 94.1 /100 | #122 | Exceptional 75.8% |
| Immigrants | Bulgaria | 94.1 /100 | #123 | Exceptional 75.8% |
| Immigrants | Sierra Leone | 93.8 /100 | #124 | Exceptional 75.8% |