Immigrants from Nigeria vs Apache In Labor Force | Age 20-24
COMPARE
Immigrants from Nigeria
Apache
In Labor Force | Age 20-24
In Labor Force | Age 20-24 Comparison
Immigrants from Nigeria
Apache
74.7%
IN LABOR FORCE | AGE 20-24
24.2/ 100
METRIC RATING
198th/ 347
METRIC RANK
72.0%
IN LABOR FORCE | AGE 20-24
0.0/ 100
METRIC RATING
311th/ 347
METRIC RANK
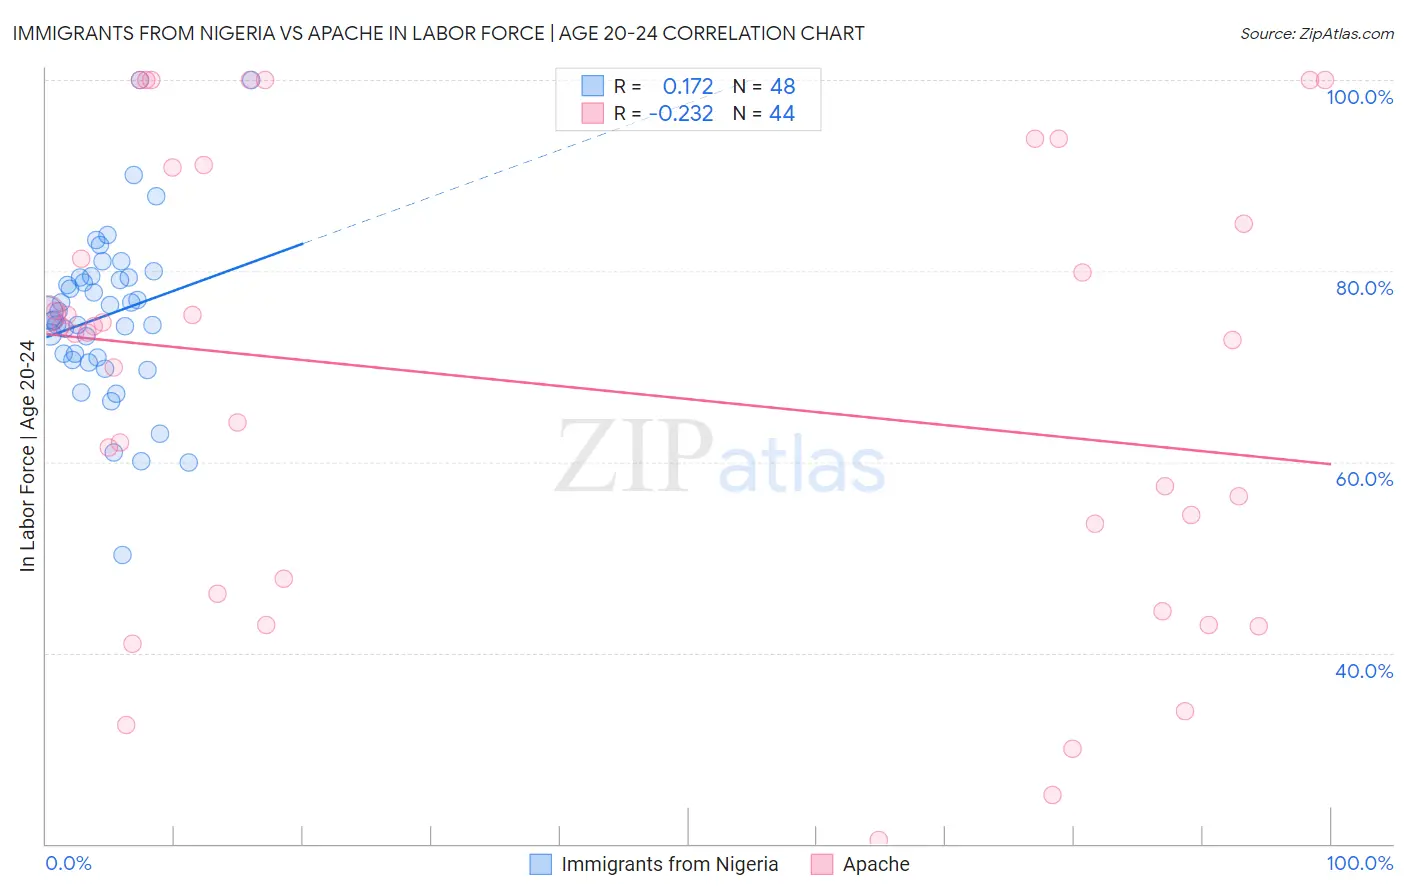
Immigrants from Nigeria vs Apache In Labor Force | Age 20-24 Correlation Chart
The statistical analysis conducted on geographies consisting of 283,465,433 people shows a poor positive correlation between the proportion of Immigrants from Nigeria and labor force participation rate among population between the ages 20 and 24 in the United States with a correlation coefficient (R) of 0.172 and weighted average of 74.7%. Similarly, the statistical analysis conducted on geographies consisting of 231,058,831 people shows a weak negative correlation between the proportion of Apache and labor force participation rate among population between the ages 20 and 24 in the United States with a correlation coefficient (R) of -0.232 and weighted average of 72.0%, a difference of 3.8%.
In Labor Force | Age 20-24 Correlation Summary
| Measurement | Immigrants from Nigeria | Apache |
| Minimum | 50.3% | 20.4% |
| Maximum | 100.0% | 100.0% |
| Range | 49.7% | 79.6% |
| Mean | 75.3% | 67.9% |
| Median | 75.2% | 73.5% |
| Interquartile 25% (IQ1) | 70.8% | 47.0% |
| Interquartile 75% (IQ3) | 79.3% | 87.9% |
| Interquartile Range (IQR) | 8.5% | 40.9% |
| Standard Deviation (Sample) | 9.0% | 23.3% |
| Standard Deviation (Population) | 8.9% | 23.1% |
Similar Demographics by In Labor Force | Age 20-24
Demographics Similar to Immigrants from Nigeria by In Labor Force | Age 20-24
In terms of in labor force | age 20-24, the demographic groups most similar to Immigrants from Nigeria are Eastern European (74.8%, a difference of 0.020%), Immigrants from Vietnam (74.7%, a difference of 0.020%), Panamanian (74.7%, a difference of 0.020%), Taiwanese (74.7%, a difference of 0.020%), and Immigrants from Denmark (74.8%, a difference of 0.030%).
| Demographics | Rating | Rank | In Labor Force | Age 20-24 |
| Senegalese | 28.1 /100 | #191 | Fair 74.8% |
| Immigrants | Europe | 27.5 /100 | #192 | Fair 74.8% |
| Alsatians | 27.1 /100 | #193 | Fair 74.8% |
| Immigrants | Denmark | 25.8 /100 | #194 | Fair 74.8% |
| Eastern Europeans | 25.4 /100 | #195 | Fair 74.8% |
| Immigrants | Vietnam | 25.1 /100 | #196 | Fair 74.7% |
| Panamanians | 25.0 /100 | #197 | Fair 74.7% |
| Immigrants | Nigeria | 24.2 /100 | #198 | Fair 74.7% |
| Taiwanese | 23.2 /100 | #199 | Fair 74.7% |
| Nigerians | 21.9 /100 | #200 | Fair 74.7% |
| Choctaw | 21.4 /100 | #201 | Fair 74.7% |
| Moroccans | 20.4 /100 | #202 | Fair 74.7% |
| Immigrants | Northern Africa | 17.9 /100 | #203 | Poor 74.6% |
| Immigrants | Italy | 17.6 /100 | #204 | Poor 74.6% |
| Inupiat | 17.6 /100 | #205 | Poor 74.6% |
Demographics Similar to Apache by In Labor Force | Age 20-24
In terms of in labor force | age 20-24, the demographic groups most similar to Apache are Immigrants from Cuba (72.0%, a difference of 0.010%), Immigrants from Caribbean (71.9%, a difference of 0.070%), Immigrants from Dominica (71.9%, a difference of 0.12%), Indian (Asian) (71.9%, a difference of 0.13%), and Immigrants from Iran (71.8%, a difference of 0.22%).
| Demographics | Rating | Rank | In Labor Force | Age 20-24 |
| Immigrants | West Indies | 0.0 /100 | #304 | Tragic 72.4% |
| Immigrants | Singapore | 0.0 /100 | #305 | Tragic 72.4% |
| Immigrants | Jamaica | 0.0 /100 | #306 | Tragic 72.4% |
| Immigrants | Ecuador | 0.0 /100 | #307 | Tragic 72.3% |
| Soviet Union | 0.0 /100 | #308 | Tragic 72.3% |
| Tsimshian | 0.0 /100 | #309 | Tragic 72.3% |
| Immigrants | Cuba | 0.0 /100 | #310 | Tragic 72.0% |
| Apache | 0.0 /100 | #311 | Tragic 72.0% |
| Immigrants | Caribbean | 0.0 /100 | #312 | Tragic 71.9% |
| Immigrants | Dominica | 0.0 /100 | #313 | Tragic 71.9% |
| Indians (Asian) | 0.0 /100 | #314 | Tragic 71.9% |
| Immigrants | Iran | 0.0 /100 | #315 | Tragic 71.8% |
| Immigrants | Eastern Asia | 0.0 /100 | #316 | Tragic 71.8% |
| Immigrants | Armenia | 0.0 /100 | #317 | Tragic 71.7% |
| Immigrants | Hong Kong | 0.0 /100 | #318 | Tragic 71.6% |