Immigrants from Nigeria vs Thai In Labor Force | Age 20-64
COMPARE
Immigrants from Nigeria
Thai
In Labor Force | Age 20-64
In Labor Force | Age 20-64 Comparison
Immigrants from Nigeria
Thais
79.9%
IN LABOR FORCE | AGE 20-64
86.4/ 100
METRIC RATING
138th/ 347
METRIC RANK
80.9%
IN LABOR FORCE | AGE 20-64
100.0/ 100
METRIC RATING
20th/ 347
METRIC RANK
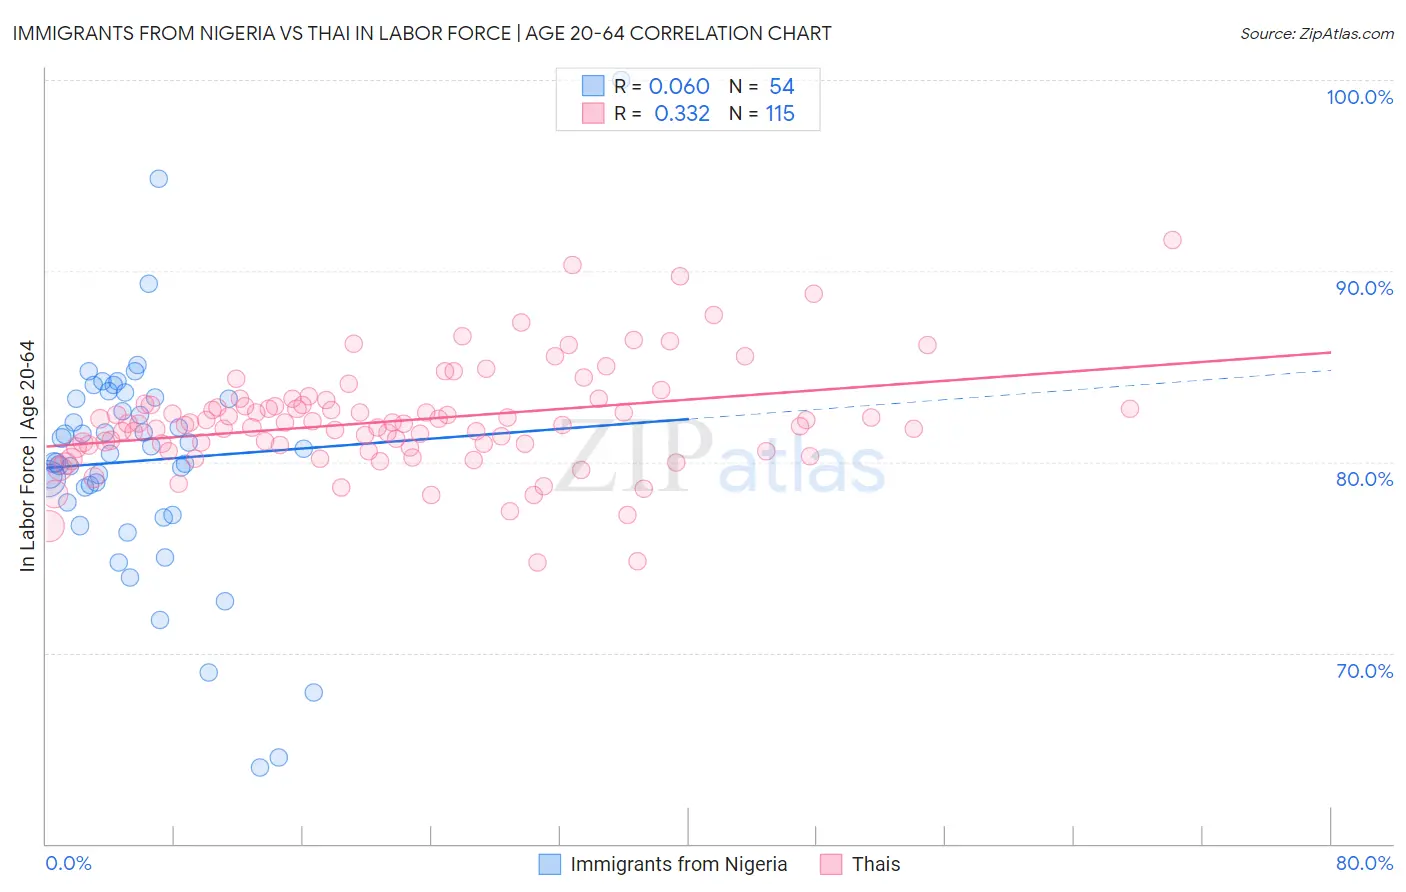
Immigrants from Nigeria vs Thai In Labor Force | Age 20-64 Correlation Chart
The statistical analysis conducted on geographies consisting of 283,492,708 people shows a slight positive correlation between the proportion of Immigrants from Nigeria and labor force participation rate among population between the ages 20 and 64 in the United States with a correlation coefficient (R) of 0.060 and weighted average of 79.9%. Similarly, the statistical analysis conducted on geographies consisting of 475,903,874 people shows a mild positive correlation between the proportion of Thais and labor force participation rate among population between the ages 20 and 64 in the United States with a correlation coefficient (R) of 0.332 and weighted average of 80.9%, a difference of 1.3%.
In Labor Force | Age 20-64 Correlation Summary
| Measurement | Immigrants from Nigeria | Thai |
| Minimum | 64.0% | 74.7% |
| Maximum | 100.0% | 91.6% |
| Range | 36.0% | 16.9% |
| Mean | 80.1% | 82.2% |
| Median | 80.6% | 82.0% |
| Interquartile 25% (IQ1) | 77.9% | 80.7% |
| Interquartile 75% (IQ3) | 83.3% | 83.0% |
| Interquartile Range (IQR) | 5.4% | 2.2% |
| Standard Deviation (Sample) | 6.1% | 2.8% |
| Standard Deviation (Population) | 6.0% | 2.7% |
Similar Demographics by In Labor Force | Age 20-64
Demographics Similar to Immigrants from Nigeria by In Labor Force | Age 20-64
In terms of in labor force | age 20-64, the demographic groups most similar to Immigrants from Nigeria are Immigrants from Ukraine (79.9%, a difference of 0.0%), Ukrainian (79.9%, a difference of 0.010%), Immigrants from Singapore (79.9%, a difference of 0.010%), Indian (Asian) (79.9%, a difference of 0.020%), and South American Indian (79.9%, a difference of 0.020%).
| Demographics | Rating | Rank | In Labor Force | Age 20-64 |
| Immigrants | Iran | 88.3 /100 | #131 | Excellent 79.9% |
| Indians (Asian) | 87.7 /100 | #132 | Excellent 79.9% |
| South American Indians | 87.6 /100 | #133 | Excellent 79.9% |
| Belgians | 87.4 /100 | #134 | Excellent 79.9% |
| Ukrainians | 86.8 /100 | #135 | Excellent 79.9% |
| Immigrants | Singapore | 86.7 /100 | #136 | Excellent 79.9% |
| Immigrants | Ukraine | 86.5 /100 | #137 | Excellent 79.9% |
| Immigrants | Nigeria | 86.4 /100 | #138 | Excellent 79.9% |
| Immigrants | Spain | 83.9 /100 | #139 | Excellent 79.8% |
| Immigrants | South Eastern Asia | 80.4 /100 | #140 | Excellent 79.8% |
| Immigrants | Israel | 80.0 /100 | #141 | Good 79.8% |
| Slovaks | 79.9 /100 | #142 | Good 79.8% |
| Immigrants | Sweden | 79.7 /100 | #143 | Good 79.8% |
| Koreans | 79.6 /100 | #144 | Good 79.8% |
| Pakistanis | 79.3 /100 | #145 | Good 79.8% |
Demographics Similar to Thais by In Labor Force | Age 20-64
In terms of in labor force | age 20-64, the demographic groups most similar to Thais are Liberian (80.9%, a difference of 0.020%), Zimbabwean (81.0%, a difference of 0.050%), Immigrants from Bulgaria (81.0%, a difference of 0.060%), Norwegian (81.0%, a difference of 0.070%), and Sudanese (80.8%, a difference of 0.090%).
| Demographics | Rating | Rank | In Labor Force | Age 20-64 |
| Immigrants | India | 100.0 /100 | #13 | Exceptional 81.3% |
| Cambodians | 100.0 /100 | #14 | Exceptional 81.1% |
| Bulgarians | 100.0 /100 | #15 | Exceptional 81.1% |
| Immigrants | Nepal | 100.0 /100 | #16 | Exceptional 81.1% |
| Norwegians | 100.0 /100 | #17 | Exceptional 81.0% |
| Immigrants | Bulgaria | 100.0 /100 | #18 | Exceptional 81.0% |
| Zimbabweans | 100.0 /100 | #19 | Exceptional 81.0% |
| Thais | 100.0 /100 | #20 | Exceptional 80.9% |
| Liberians | 100.0 /100 | #21 | Exceptional 80.9% |
| Sudanese | 100.0 /100 | #22 | Exceptional 80.8% |
| Immigrants | Bosnia and Herzegovina | 100.0 /100 | #23 | Exceptional 80.8% |
| Immigrants | Morocco | 100.0 /100 | #24 | Exceptional 80.8% |
| Kenyans | 100.0 /100 | #25 | Exceptional 80.8% |
| Immigrants | Serbia | 100.0 /100 | #26 | Exceptional 80.8% |
| Immigrants | Kenya | 99.9 /100 | #27 | Exceptional 80.7% |