Immigrants from Nigeria vs Assyrian/Chaldean/Syriac Doctorate Degree
COMPARE
Immigrants from Nigeria
Assyrian/Chaldean/Syriac
Doctorate Degree
Doctorate Degree Comparison
Immigrants from Nigeria
Assyrians/Chaldeans/Syriacs
1.8%
DOCTORATE DEGREE
22.4/ 100
METRIC RATING
201st/ 347
METRIC RANK
1.7%
DOCTORATE DEGREE
5.9/ 100
METRIC RATING
228th/ 347
METRIC RANK
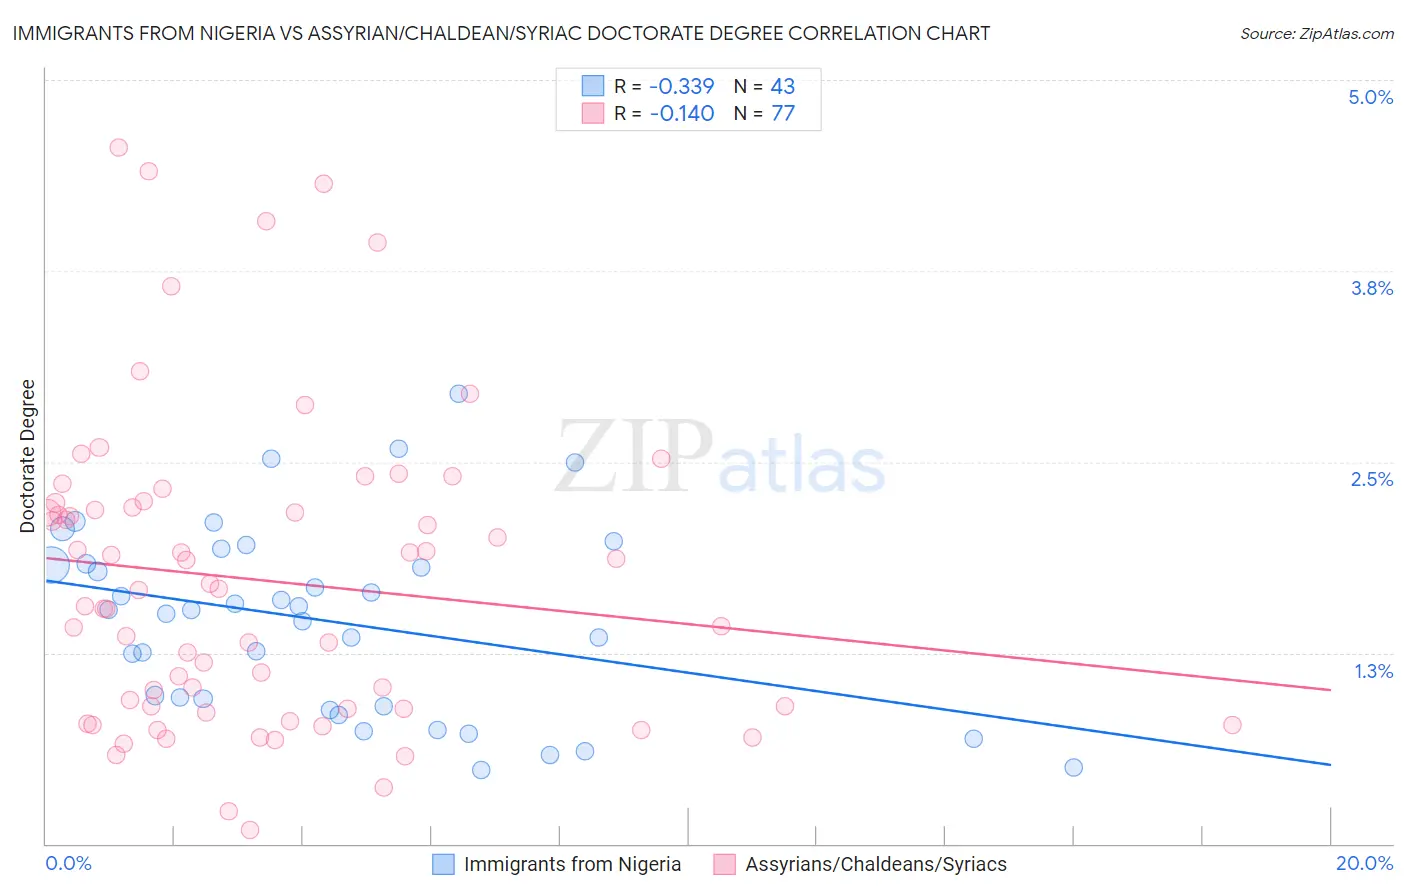
Immigrants from Nigeria vs Assyrian/Chaldean/Syriac Doctorate Degree Correlation Chart
The statistical analysis conducted on geographies consisting of 282,146,765 people shows a mild negative correlation between the proportion of Immigrants from Nigeria and percentage of population with at least doctorate degree education in the United States with a correlation coefficient (R) of -0.339 and weighted average of 1.8%. Similarly, the statistical analysis conducted on geographies consisting of 110,001,704 people shows a poor negative correlation between the proportion of Assyrians/Chaldeans/Syriacs and percentage of population with at least doctorate degree education in the United States with a correlation coefficient (R) of -0.140 and weighted average of 1.7%, a difference of 6.2%.
Doctorate Degree Correlation Summary
| Measurement | Immigrants from Nigeria | Assyrian/Chaldean/Syriac |
| Minimum | 0.48% | 0.087% |
| Maximum | 2.9% | 4.6% |
| Range | 2.5% | 4.5% |
| Mean | 1.5% | 1.7% |
| Median | 1.5% | 1.7% |
| Interquartile 25% (IQ1) | 0.90% | 0.88% |
| Interquartile 75% (IQ3) | 1.8% | 2.2% |
| Interquartile Range (IQR) | 0.93% | 1.3% |
| Standard Deviation (Sample) | 0.61% | 1.0% |
| Standard Deviation (Population) | 0.61% | 1.00% |
Similar Demographics by Doctorate Degree
Demographics Similar to Immigrants from Nigeria by Doctorate Degree
In terms of doctorate degree, the demographic groups most similar to Immigrants from Nigeria are White/Caucasian (1.8%, a difference of 0.070%), Immigrants from South America (1.8%, a difference of 0.18%), Portuguese (1.8%, a difference of 0.23%), Immigrants from Vietnam (1.8%, a difference of 0.25%), and Somali (1.7%, a difference of 0.28%).
| Demographics | Rating | Rank | Doctorate Degree |
| Uruguayans | 26.2 /100 | #194 | Fair 1.8% |
| Immigrants | Somalia | 25.4 /100 | #195 | Fair 1.8% |
| Sub-Saharan Africans | 25.1 /100 | #196 | Fair 1.8% |
| Chinese | 25.1 /100 | #197 | Fair 1.8% |
| Immigrants | Ghana | 24.6 /100 | #198 | Fair 1.8% |
| Immigrants | South America | 23.3 /100 | #199 | Fair 1.8% |
| Whites/Caucasians | 22.8 /100 | #200 | Fair 1.8% |
| Immigrants | Nigeria | 22.4 /100 | #201 | Fair 1.8% |
| Portuguese | 21.4 /100 | #202 | Fair 1.8% |
| Immigrants | Vietnam | 21.4 /100 | #203 | Fair 1.8% |
| Somalis | 21.2 /100 | #204 | Fair 1.7% |
| Venezuelans | 19.5 /100 | #205 | Poor 1.7% |
| Immigrants | Peru | 17.6 /100 | #206 | Poor 1.7% |
| Yugoslavians | 17.1 /100 | #207 | Poor 1.7% |
| Colombians | 16.1 /100 | #208 | Poor 1.7% |
Demographics Similar to Assyrians/Chaldeans/Syriacs by Doctorate Degree
In terms of doctorate degree, the demographic groups most similar to Assyrians/Chaldeans/Syriacs are Panamanian (1.7%, a difference of 0.28%), Osage (1.7%, a difference of 0.42%), Immigrants from Colombia (1.7%, a difference of 0.53%), Colville (1.6%, a difference of 1.0%), and Immigrants from Poland (1.7%, a difference of 1.0%).
| Demographics | Rating | Rank | Doctorate Degree |
| Immigrants | Nonimmigrants | 8.8 /100 | #221 | Tragic 1.7% |
| Immigrants | Venezuela | 8.7 /100 | #222 | Tragic 1.7% |
| Immigrants | Bosnia and Herzegovina | 7.8 /100 | #223 | Tragic 1.7% |
| Immigrants | Poland | 7.4 /100 | #224 | Tragic 1.7% |
| Immigrants | Colombia | 6.7 /100 | #225 | Tragic 1.7% |
| Osage | 6.5 /100 | #226 | Tragic 1.7% |
| Panamanians | 6.3 /100 | #227 | Tragic 1.7% |
| Assyrians/Chaldeans/Syriacs | 5.9 /100 | #228 | Tragic 1.7% |
| Colville | 4.7 /100 | #229 | Tragic 1.6% |
| Immigrants | Philippines | 4.3 /100 | #230 | Tragic 1.6% |
| Immigrants | North Macedonia | 3.9 /100 | #231 | Tragic 1.6% |
| Guamanians/Chamorros | 3.3 /100 | #232 | Tragic 1.6% |
| Barbadians | 3.3 /100 | #233 | Tragic 1.6% |
| Hopi | 3.2 /100 | #234 | Tragic 1.6% |
| Cree | 3.0 /100 | #235 | Tragic 1.6% |