Immigrants from Nigeria vs Assyrian/Chaldean/Syriac Unemployment Among Ages 45 to 54 years
COMPARE
Immigrants from Nigeria
Assyrian/Chaldean/Syriac
Unemployment Among Ages 45 to 54 years
Unemployment Among Ages 45 to 54 years Comparison
Immigrants from Nigeria
Assyrians/Chaldeans/Syriacs
4.6%
UNEMPLOYMENT AMONG AGES 45 TO 54 YEARS
13.3/ 100
METRIC RATING
209th/ 347
METRIC RANK
4.7%
UNEMPLOYMENT AMONG AGES 45 TO 54 YEARS
3.5/ 100
METRIC RATING
226th/ 347
METRIC RANK
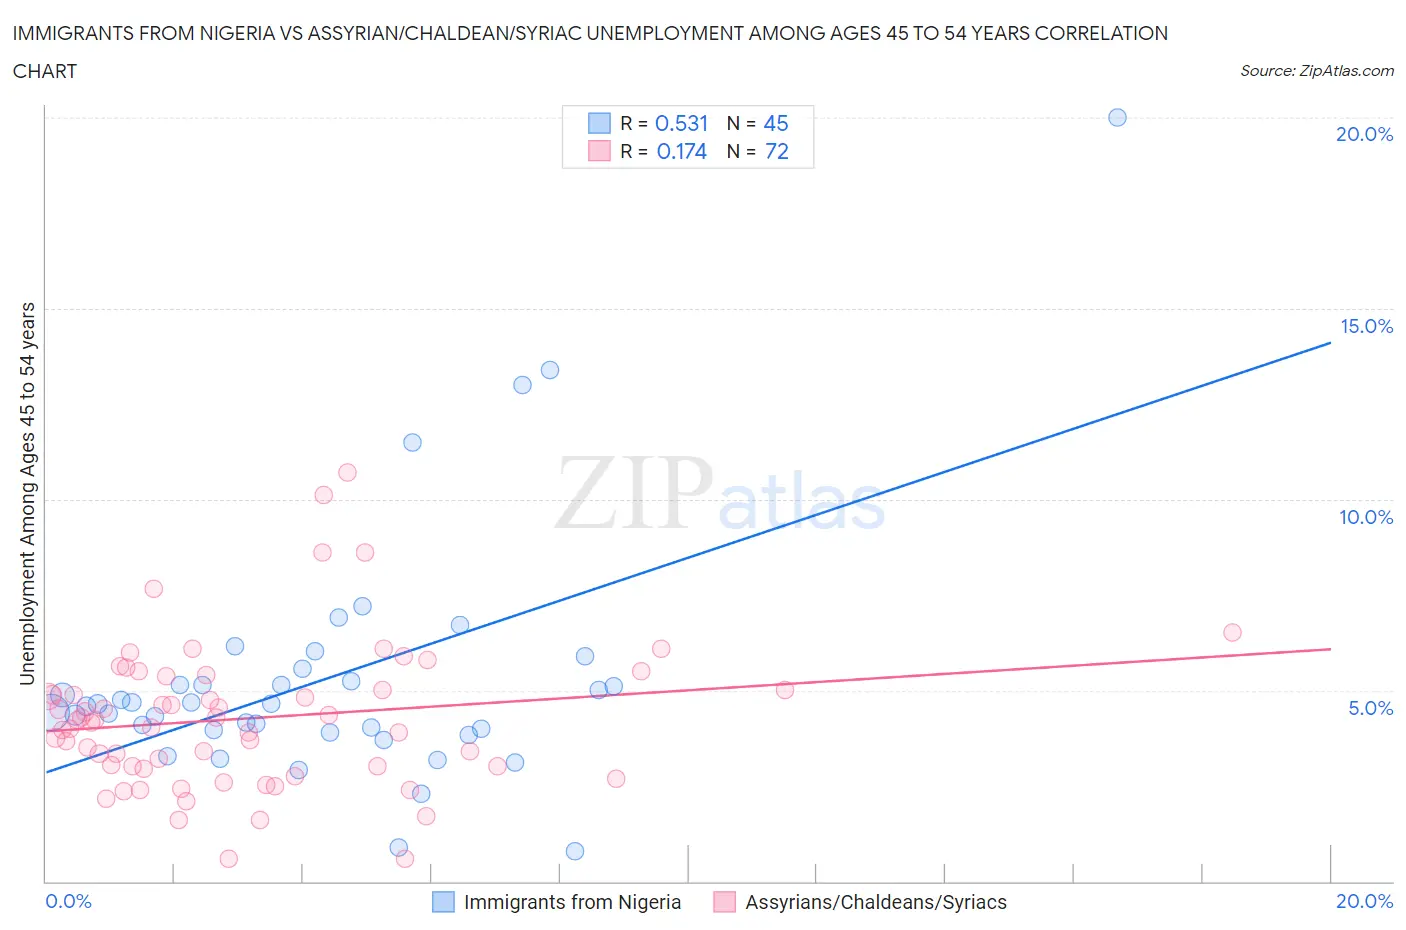
Immigrants from Nigeria vs Assyrian/Chaldean/Syriac Unemployment Among Ages 45 to 54 years Correlation Chart
The statistical analysis conducted on geographies consisting of 279,785,103 people shows a substantial positive correlation between the proportion of Immigrants from Nigeria and unemployment rate among population between the ages 45 and 54 in the United States with a correlation coefficient (R) of 0.531 and weighted average of 4.6%. Similarly, the statistical analysis conducted on geographies consisting of 109,531,563 people shows a poor positive correlation between the proportion of Assyrians/Chaldeans/Syriacs and unemployment rate among population between the ages 45 and 54 in the United States with a correlation coefficient (R) of 0.174 and weighted average of 4.7%, a difference of 1.7%.
Unemployment Among Ages 45 to 54 years Correlation Summary
| Measurement | Immigrants from Nigeria | Assyrian/Chaldean/Syriac |
| Minimum | 0.80% | 0.60% |
| Maximum | 20.0% | 10.7% |
| Range | 19.2% | 10.1% |
| Mean | 5.3% | 4.3% |
| Median | 4.6% | 4.2% |
| Interquartile 25% (IQ1) | 3.9% | 3.0% |
| Interquartile 75% (IQ3) | 5.4% | 5.2% |
| Interquartile Range (IQR) | 1.5% | 2.2% |
| Standard Deviation (Sample) | 3.3% | 1.9% |
| Standard Deviation (Population) | 3.3% | 1.9% |
Demographics Similar to Immigrants from Nigeria and Assyrians/Chaldeans/Syriacs by Unemployment Among Ages 45 to 54 years
In terms of unemployment among ages 45 to 54 years, the demographic groups most similar to Immigrants from Nigeria are Immigrants from Africa (4.6%, a difference of 0.030%), Arab (4.6%, a difference of 0.050%), Immigrants from South America (4.6%, a difference of 0.11%), Creek (4.6%, a difference of 0.14%), and Immigrants from Iran (4.6%, a difference of 0.18%). Similarly, the demographic groups most similar to Assyrians/Chaldeans/Syriacs are Iraqi (4.7%, a difference of 0.090%), Comanche (4.7%, a difference of 0.37%), Immigrants from Norway (4.7%, a difference of 0.37%), Potawatomi (4.7%, a difference of 0.58%), and Immigrants from Southern Europe (4.7%, a difference of 0.64%).
| Demographics | Rating | Rank | Unemployment Among Ages 45 to 54 years |
| Arabs | 13.7 /100 | #207 | Poor 4.6% |
| Immigrants | Africa | 13.6 /100 | #208 | Poor 4.6% |
| Immigrants | Nigeria | 13.3 /100 | #209 | Poor 4.6% |
| Immigrants | South America | 12.2 /100 | #210 | Poor 4.6% |
| Creek | 11.9 /100 | #211 | Poor 4.6% |
| Immigrants | Iran | 11.5 /100 | #212 | Poor 4.6% |
| Panamanians | 10.7 /100 | #213 | Poor 4.6% |
| Cherokee | 10.6 /100 | #214 | Poor 4.6% |
| Immigrants | Panama | 10.4 /100 | #215 | Poor 4.6% |
| Lumbee | 9.2 /100 | #216 | Tragic 4.6% |
| Immigrants | Cambodia | 7.4 /100 | #217 | Tragic 4.7% |
| Immigrants | Uganda | 7.1 /100 | #218 | Tragic 4.7% |
| Nigerians | 7.0 /100 | #219 | Tragic 4.7% |
| Guamanians/Chamorros | 6.8 /100 | #220 | Tragic 4.7% |
| Choctaw | 6.1 /100 | #221 | Tragic 4.7% |
| Immigrants | Southern Europe | 6.0 /100 | #222 | Tragic 4.7% |
| Potawatomi | 5.7 /100 | #223 | Tragic 4.7% |
| Comanche | 4.8 /100 | #224 | Tragic 4.7% |
| Immigrants | Norway | 4.8 /100 | #225 | Tragic 4.7% |
| Assyrians/Chaldeans/Syriacs | 3.5 /100 | #226 | Tragic 4.7% |
| Iraqis | 3.2 /100 | #227 | Tragic 4.7% |