Bhutanese vs Assyrian/Chaldean/Syriac In Labor Force | Age 20-24
COMPARE
Bhutanese
Assyrian/Chaldean/Syriac
In Labor Force | Age 20-24
In Labor Force | Age 20-24 Comparison
Bhutanese
Assyrians/Chaldeans/Syriacs
75.4%
IN LABOR FORCE | AGE 20-24
80.8/ 100
METRIC RATING
144th/ 347
METRIC RANK
75.9%
IN LABOR FORCE | AGE 20-24
94.9/ 100
METRIC RATING
117th/ 347
METRIC RANK
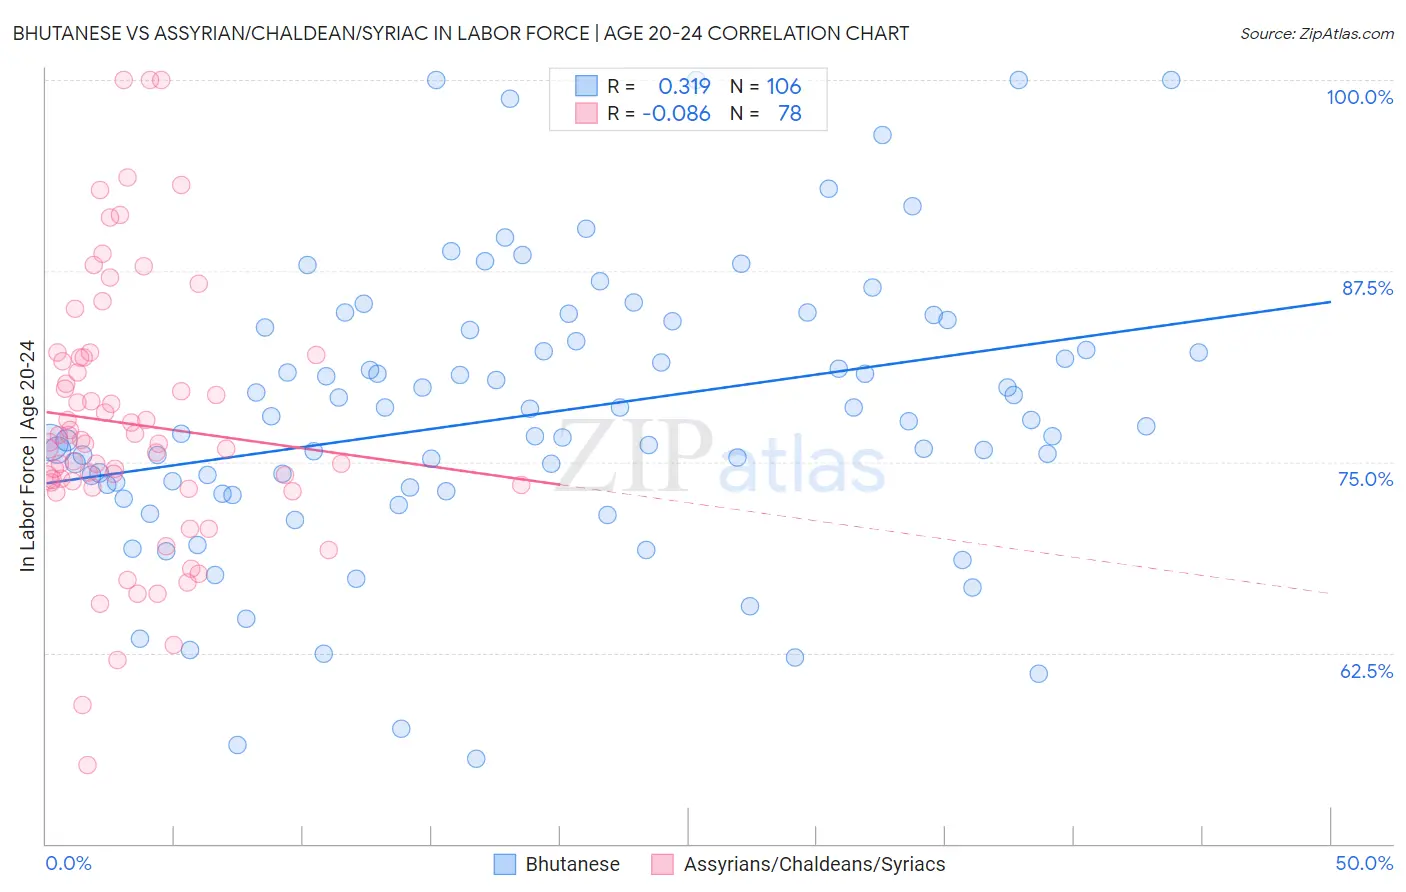
Bhutanese vs Assyrian/Chaldean/Syriac In Labor Force | Age 20-24 Correlation Chart
The statistical analysis conducted on geographies consisting of 455,273,075 people shows a mild positive correlation between the proportion of Bhutanese and labor force participation rate among population between the ages 20 and 24 in the United States with a correlation coefficient (R) of 0.319 and weighted average of 75.4%. Similarly, the statistical analysis conducted on geographies consisting of 110,301,769 people shows a slight negative correlation between the proportion of Assyrians/Chaldeans/Syriacs and labor force participation rate among population between the ages 20 and 24 in the United States with a correlation coefficient (R) of -0.086 and weighted average of 75.9%, a difference of 0.54%.
In Labor Force | Age 20-24 Correlation Summary
| Measurement | Bhutanese | Assyrian/Chaldean/Syriac |
| Minimum | 55.6% | 55.2% |
| Maximum | 100.0% | 100.0% |
| Range | 44.4% | 44.8% |
| Mean | 78.1% | 77.5% |
| Median | 77.5% | 76.3% |
| Interquartile 25% (IQ1) | 73.3% | 73.5% |
| Interquartile 75% (IQ3) | 83.6% | 81.9% |
| Interquartile Range (IQR) | 10.3% | 8.4% |
| Standard Deviation (Sample) | 9.2% | 8.8% |
| Standard Deviation (Population) | 9.1% | 8.7% |
Similar Demographics by In Labor Force | Age 20-24
Demographics Similar to Bhutanese by In Labor Force | Age 20-24
In terms of in labor force | age 20-24, the demographic groups most similar to Bhutanese are Spaniard (75.5%, a difference of 0.030%), Korean (75.4%, a difference of 0.030%), Mexican American Indian (75.4%, a difference of 0.050%), Blackfeet (75.5%, a difference of 0.070%), and Comanche (75.4%, a difference of 0.070%).
| Demographics | Rating | Rank | In Labor Force | Age 20-24 |
| Jordanians | 84.8 /100 | #137 | Excellent 75.5% |
| Australians | 84.8 /100 | #138 | Excellent 75.5% |
| Immigrants | England | 84.6 /100 | #139 | Excellent 75.5% |
| Delaware | 84.5 /100 | #140 | Excellent 75.5% |
| Romanians | 84.1 /100 | #141 | Excellent 75.5% |
| Blackfeet | 83.6 /100 | #142 | Excellent 75.5% |
| Spaniards | 82.0 /100 | #143 | Excellent 75.5% |
| Bhutanese | 80.8 /100 | #144 | Excellent 75.4% |
| Koreans | 79.7 /100 | #145 | Good 75.4% |
| Mexican American Indians | 78.8 /100 | #146 | Good 75.4% |
| Comanche | 77.6 /100 | #147 | Good 75.4% |
| Immigrants | Cambodia | 76.7 /100 | #148 | Good 75.4% |
| Ugandans | 76.1 /100 | #149 | Good 75.4% |
| Salvadorans | 74.8 /100 | #150 | Good 75.3% |
| Paiute | 74.1 /100 | #151 | Good 75.3% |
Demographics Similar to Assyrians/Chaldeans/Syriacs by In Labor Force | Age 20-24
In terms of in labor force | age 20-24, the demographic groups most similar to Assyrians/Chaldeans/Syriacs are Alaska Native (75.9%, a difference of 0.010%), Immigrants from North America (75.9%, a difference of 0.010%), Spanish American (75.8%, a difference of 0.010%), Immigrants from Portugal (75.8%, a difference of 0.010%), and Immigrants from Zimbabwe (75.9%, a difference of 0.020%).
| Demographics | Rating | Rank | In Labor Force | Age 20-24 |
| Immigrants | Morocco | 95.8 /100 | #110 | Exceptional 75.9% |
| Ukrainians | 95.7 /100 | #111 | Exceptional 75.9% |
| Immigrants | Canada | 95.6 /100 | #112 | Exceptional 75.9% |
| Immigrants | Netherlands | 95.3 /100 | #113 | Exceptional 75.9% |
| Immigrants | Zimbabwe | 95.1 /100 | #114 | Exceptional 75.9% |
| Alaska Natives | 95.1 /100 | #115 | Exceptional 75.9% |
| Immigrants | North America | 95.0 /100 | #116 | Exceptional 75.9% |
| Assyrians/Chaldeans/Syriacs | 94.9 /100 | #117 | Exceptional 75.9% |
| Spanish Americans | 94.8 /100 | #118 | Exceptional 75.8% |
| Immigrants | Portugal | 94.8 /100 | #119 | Exceptional 75.8% |
| Immigrants | Africa | 94.6 /100 | #120 | Exceptional 75.8% |
| Immigrants | Serbia | 94.3 /100 | #121 | Exceptional 75.8% |
| Pakistanis | 94.1 /100 | #122 | Exceptional 75.8% |
| Immigrants | Bulgaria | 94.1 /100 | #123 | Exceptional 75.8% |
| Immigrants | Sierra Leone | 93.8 /100 | #124 | Exceptional 75.8% |