Haitian vs Tohono O'odham In Labor Force | Age 45-54
COMPARE
Haitian
Tohono O'odham
In Labor Force | Age 45-54
In Labor Force | Age 45-54 Comparison
Haitians
Tohono O'odham
82.8%
IN LABOR FORCE | AGE 45-54
61.8/ 100
METRIC RATING
162nd/ 347
METRIC RANK
75.1%
IN LABOR FORCE | AGE 45-54
0.0/ 100
METRIC RATING
342nd/ 347
METRIC RANK
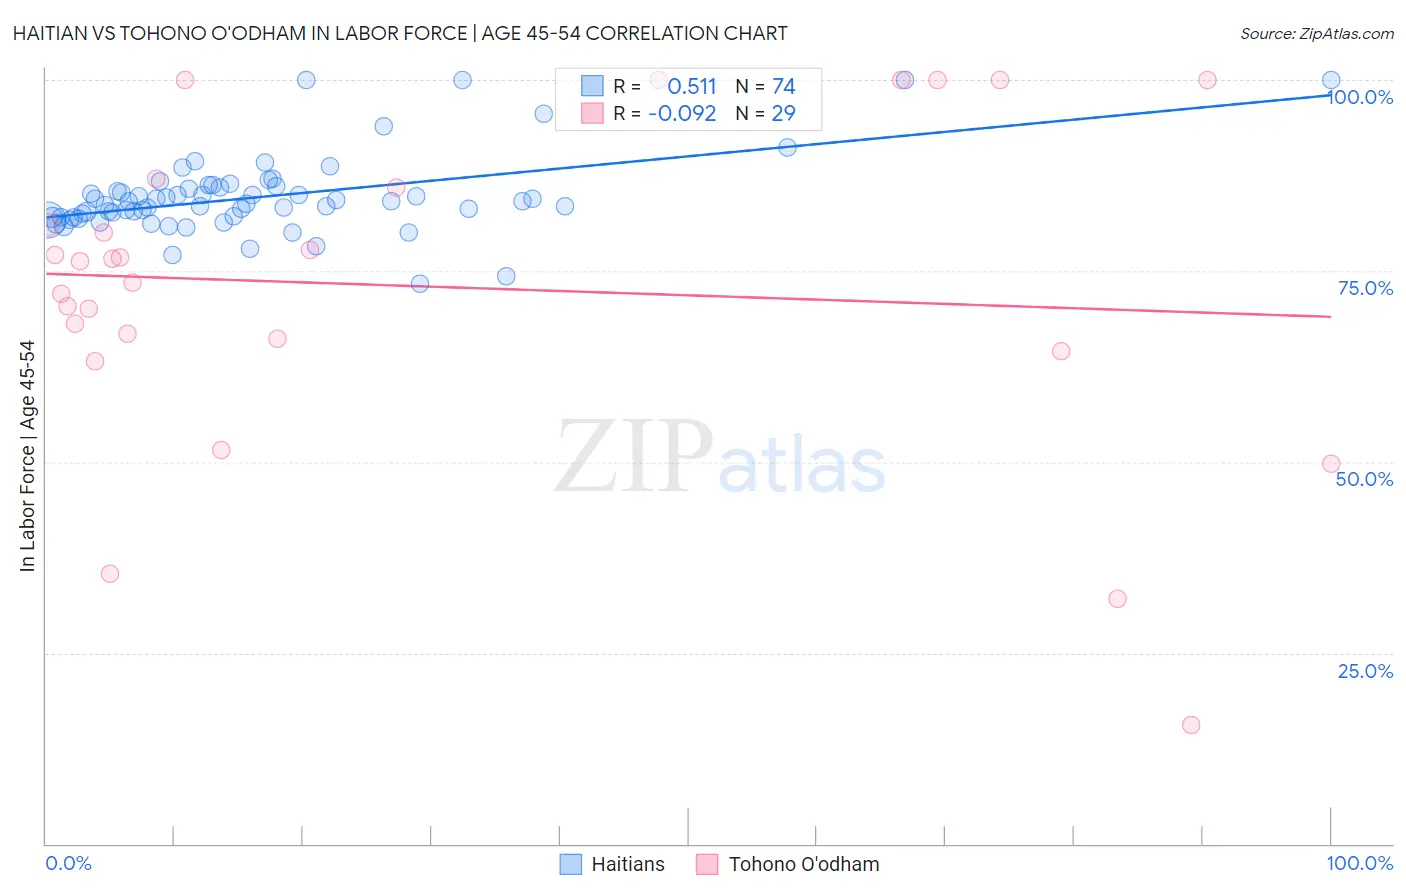
Haitian vs Tohono O'odham In Labor Force | Age 45-54 Correlation Chart
The statistical analysis conducted on geographies consisting of 287,703,107 people shows a substantial positive correlation between the proportion of Haitians and labor force participation rate among population between the ages 45 and 54 in the United States with a correlation coefficient (R) of 0.511 and weighted average of 82.8%. Similarly, the statistical analysis conducted on geographies consisting of 58,717,652 people shows a slight negative correlation between the proportion of Tohono O'odham and labor force participation rate among population between the ages 45 and 54 in the United States with a correlation coefficient (R) of -0.092 and weighted average of 75.1%, a difference of 10.3%.
In Labor Force | Age 45-54 Correlation Summary
| Measurement | Haitian | Tohono O'odham |
| Minimum | 73.4% | 15.5% |
| Maximum | 100.0% | 100.0% |
| Range | 26.6% | 84.5% |
| Mean | 84.7% | 73.0% |
| Median | 84.0% | 76.2% |
| Interquartile 25% (IQ1) | 82.0% | 65.3% |
| Interquartile 75% (IQ3) | 85.9% | 86.5% |
| Interquartile Range (IQR) | 3.9% | 21.2% |
| Standard Deviation (Sample) | 5.1% | 21.2% |
| Standard Deviation (Population) | 5.1% | 20.9% |
Similar Demographics by In Labor Force | Age 45-54
Demographics Similar to Haitians by In Labor Force | Age 45-54
In terms of in labor force | age 45-54, the demographic groups most similar to Haitians are South American Indian (82.9%, a difference of 0.0%), Dutch (82.8%, a difference of 0.0%), German Russian (82.8%, a difference of 0.0%), Laotian (82.9%, a difference of 0.010%), and Immigrants from Sudan (82.8%, a difference of 0.020%).
| Demographics | Rating | Rank | In Labor Force | Age 45-54 |
| Immigrants | Philippines | 69.0 /100 | #155 | Good 82.9% |
| Immigrants | Saudi Arabia | 68.8 /100 | #156 | Good 82.9% |
| Immigrants | Australia | 68.2 /100 | #157 | Good 82.9% |
| Immigrants | Southern Europe | 67.8 /100 | #158 | Good 82.9% |
| Immigrants | Austria | 64.6 /100 | #159 | Good 82.9% |
| Laotians | 62.8 /100 | #160 | Good 82.9% |
| South American Indians | 62.2 /100 | #161 | Good 82.9% |
| Haitians | 61.8 /100 | #162 | Good 82.8% |
| Dutch | 61.7 /100 | #163 | Good 82.8% |
| German Russians | 61.3 /100 | #164 | Good 82.8% |
| Immigrants | Sudan | 59.9 /100 | #165 | Average 82.8% |
| Immigrants | South Eastern Asia | 57.4 /100 | #166 | Average 82.8% |
| Swiss | 56.5 /100 | #167 | Average 82.8% |
| Immigrants | South Africa | 55.8 /100 | #168 | Average 82.8% |
| Immigrants | Western Africa | 54.1 /100 | #169 | Average 82.8% |
Demographics Similar to Tohono O'odham by In Labor Force | Age 45-54
In terms of in labor force | age 45-54, the demographic groups most similar to Tohono O'odham are Hopi (75.0%, a difference of 0.18%), Pueblo (75.5%, a difference of 0.49%), Lumbee (75.6%, a difference of 0.61%), Immigrants from Yemen (74.4%, a difference of 0.96%), and Puerto Rican (75.9%, a difference of 1.1%).
| Demographics | Rating | Rank | In Labor Force | Age 45-54 |
| Natives/Alaskans | 0.0 /100 | #333 | Tragic 77.1% |
| Apache | 0.0 /100 | #334 | Tragic 77.1% |
| Arapaho | 0.0 /100 | #335 | Tragic 77.1% |
| Paiute | 0.0 /100 | #336 | Tragic 76.7% |
| Ute | 0.0 /100 | #337 | Tragic 76.6% |
| Yuman | 0.0 /100 | #338 | Tragic 76.3% |
| Puerto Ricans | 0.0 /100 | #339 | Tragic 75.9% |
| Lumbee | 0.0 /100 | #340 | Tragic 75.6% |
| Pueblo | 0.0 /100 | #341 | Tragic 75.5% |
| Tohono O'odham | 0.0 /100 | #342 | Tragic 75.1% |
| Hopi | 0.0 /100 | #343 | Tragic 75.0% |
| Immigrants | Yemen | 0.0 /100 | #344 | Tragic 74.4% |
| Houma | 0.0 /100 | #345 | Tragic 74.1% |
| Pima | 0.0 /100 | #346 | Tragic 72.8% |
| Navajo | 0.0 /100 | #347 | Tragic 72.8% |