Alaska Native vs Tohono O'odham In Labor Force | Age 45-54
COMPARE
Alaska Native
Tohono O'odham
In Labor Force | Age 45-54
In Labor Force | Age 45-54 Comparison
Alaska Natives
Tohono O'odham
81.8%
IN LABOR FORCE | AGE 45-54
0.4/ 100
METRIC RATING
245th/ 347
METRIC RANK
75.1%
IN LABOR FORCE | AGE 45-54
0.0/ 100
METRIC RATING
342nd/ 347
METRIC RANK
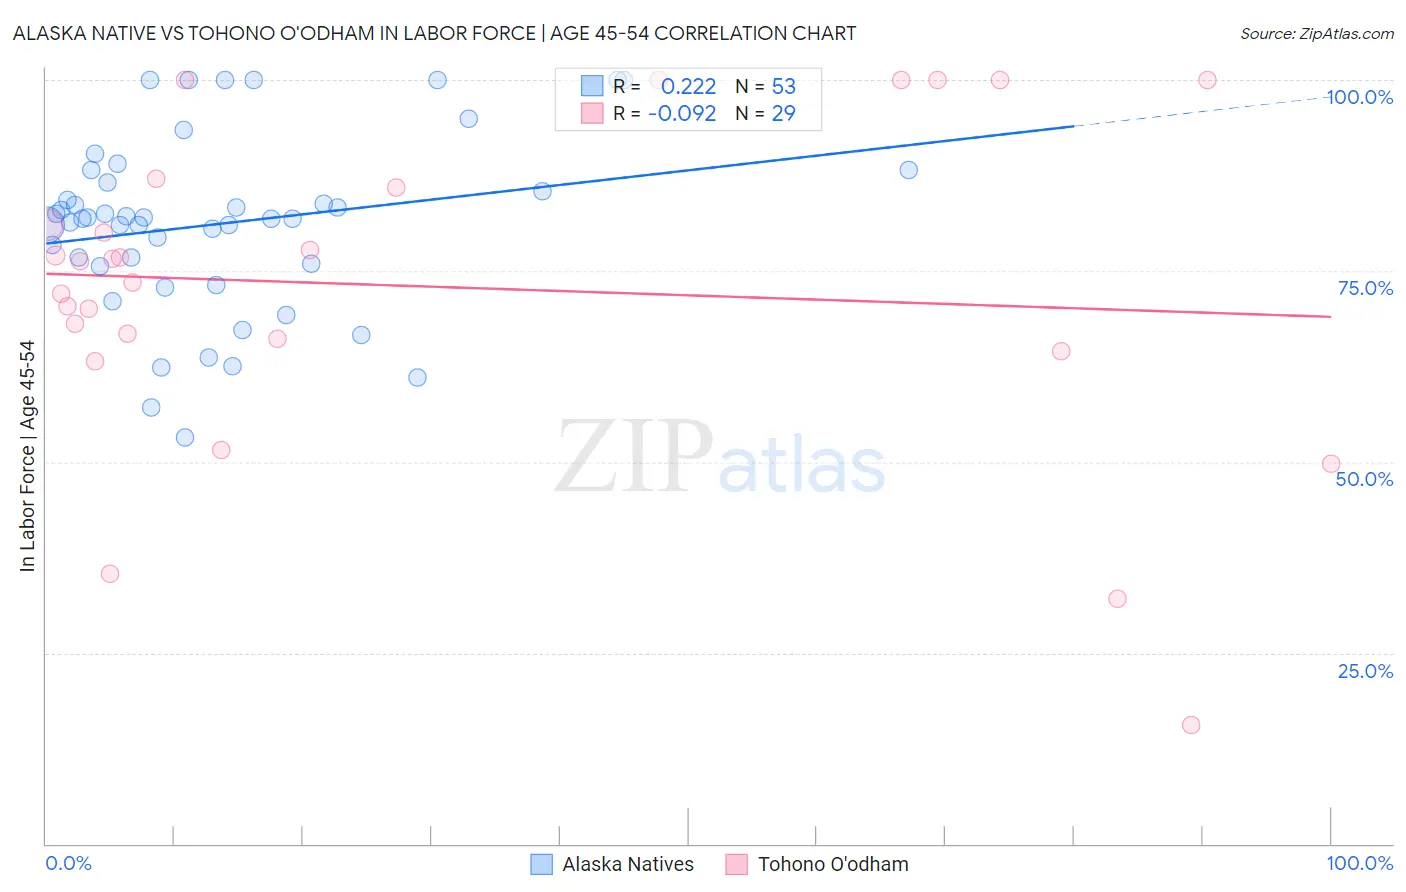
Alaska Native vs Tohono O'odham In Labor Force | Age 45-54 Correlation Chart
The statistical analysis conducted on geographies consisting of 76,757,853 people shows a weak positive correlation between the proportion of Alaska Natives and labor force participation rate among population between the ages 45 and 54 in the United States with a correlation coefficient (R) of 0.222 and weighted average of 81.8%. Similarly, the statistical analysis conducted on geographies consisting of 58,717,652 people shows a slight negative correlation between the proportion of Tohono O'odham and labor force participation rate among population between the ages 45 and 54 in the United States with a correlation coefficient (R) of -0.092 and weighted average of 75.1%, a difference of 8.8%.
In Labor Force | Age 45-54 Correlation Summary
| Measurement | Alaska Native | Tohono O'odham |
| Minimum | 53.1% | 15.5% |
| Maximum | 100.0% | 100.0% |
| Range | 46.9% | 84.5% |
| Mean | 81.2% | 73.0% |
| Median | 81.8% | 76.2% |
| Interquartile 25% (IQ1) | 75.8% | 65.3% |
| Interquartile 75% (IQ3) | 87.4% | 86.5% |
| Interquartile Range (IQR) | 11.6% | 21.2% |
| Standard Deviation (Sample) | 11.5% | 21.2% |
| Standard Deviation (Population) | 11.4% | 20.9% |
Similar Demographics by In Labor Force | Age 45-54
Demographics Similar to Alaska Natives by In Labor Force | Age 45-54
In terms of in labor force | age 45-54, the demographic groups most similar to Alaska Natives are Celtic (81.8%, a difference of 0.010%), Alaskan Athabascan (81.8%, a difference of 0.010%), Central American (81.7%, a difference of 0.020%), Puget Sound Salish (81.7%, a difference of 0.050%), and Hmong (81.7%, a difference of 0.070%).
| Demographics | Rating | Rank | In Labor Force | Age 45-54 |
| Trinidadians and Tobagonians | 1.1 /100 | #238 | Tragic 81.9% |
| Immigrants | Thailand | 1.0 /100 | #239 | Tragic 81.9% |
| Immigrants | El Salvador | 1.0 /100 | #240 | Tragic 81.9% |
| Immigrants | Cambodia | 0.8 /100 | #241 | Tragic 81.9% |
| Whites/Caucasians | 0.7 /100 | #242 | Tragic 81.9% |
| Samoans | 0.6 /100 | #243 | Tragic 81.8% |
| Celtics | 0.4 /100 | #244 | Tragic 81.8% |
| Alaska Natives | 0.4 /100 | #245 | Tragic 81.8% |
| Alaskan Athabascans | 0.4 /100 | #246 | Tragic 81.8% |
| Central Americans | 0.4 /100 | #247 | Tragic 81.7% |
| Puget Sound Salish | 0.3 /100 | #248 | Tragic 81.7% |
| Hmong | 0.3 /100 | #249 | Tragic 81.7% |
| Immigrants | Armenia | 0.2 /100 | #250 | Tragic 81.7% |
| Guamanians/Chamorros | 0.2 /100 | #251 | Tragic 81.6% |
| Pennsylvania Germans | 0.2 /100 | #252 | Tragic 81.6% |
Demographics Similar to Tohono O'odham by In Labor Force | Age 45-54
In terms of in labor force | age 45-54, the demographic groups most similar to Tohono O'odham are Hopi (75.0%, a difference of 0.18%), Pueblo (75.5%, a difference of 0.49%), Lumbee (75.6%, a difference of 0.61%), Immigrants from Yemen (74.4%, a difference of 0.96%), and Puerto Rican (75.9%, a difference of 1.1%).
| Demographics | Rating | Rank | In Labor Force | Age 45-54 |
| Natives/Alaskans | 0.0 /100 | #333 | Tragic 77.1% |
| Apache | 0.0 /100 | #334 | Tragic 77.1% |
| Arapaho | 0.0 /100 | #335 | Tragic 77.1% |
| Paiute | 0.0 /100 | #336 | Tragic 76.7% |
| Ute | 0.0 /100 | #337 | Tragic 76.6% |
| Yuman | 0.0 /100 | #338 | Tragic 76.3% |
| Puerto Ricans | 0.0 /100 | #339 | Tragic 75.9% |
| Lumbee | 0.0 /100 | #340 | Tragic 75.6% |
| Pueblo | 0.0 /100 | #341 | Tragic 75.5% |
| Tohono O'odham | 0.0 /100 | #342 | Tragic 75.1% |
| Hopi | 0.0 /100 | #343 | Tragic 75.0% |
| Immigrants | Yemen | 0.0 /100 | #344 | Tragic 74.4% |
| Houma | 0.0 /100 | #345 | Tragic 74.1% |
| Pima | 0.0 /100 | #346 | Tragic 72.8% |
| Navajo | 0.0 /100 | #347 | Tragic 72.8% |