Immigrants from Nepal vs Hispanic or Latino In Labor Force | Age 16-19
COMPARE
Immigrants from Nepal
Hispanic or Latino
In Labor Force | Age 16-19
In Labor Force | Age 16-19 Comparison
Immigrants from Nepal
Hispanics or Latinos
38.3%
IN LABOR FORCE | AGE 16-19
97.8/ 100
METRIC RATING
118th/ 347
METRIC RANK
34.5%
IN LABOR FORCE | AGE 16-19
1.1/ 100
METRIC RATING
262nd/ 347
METRIC RANK
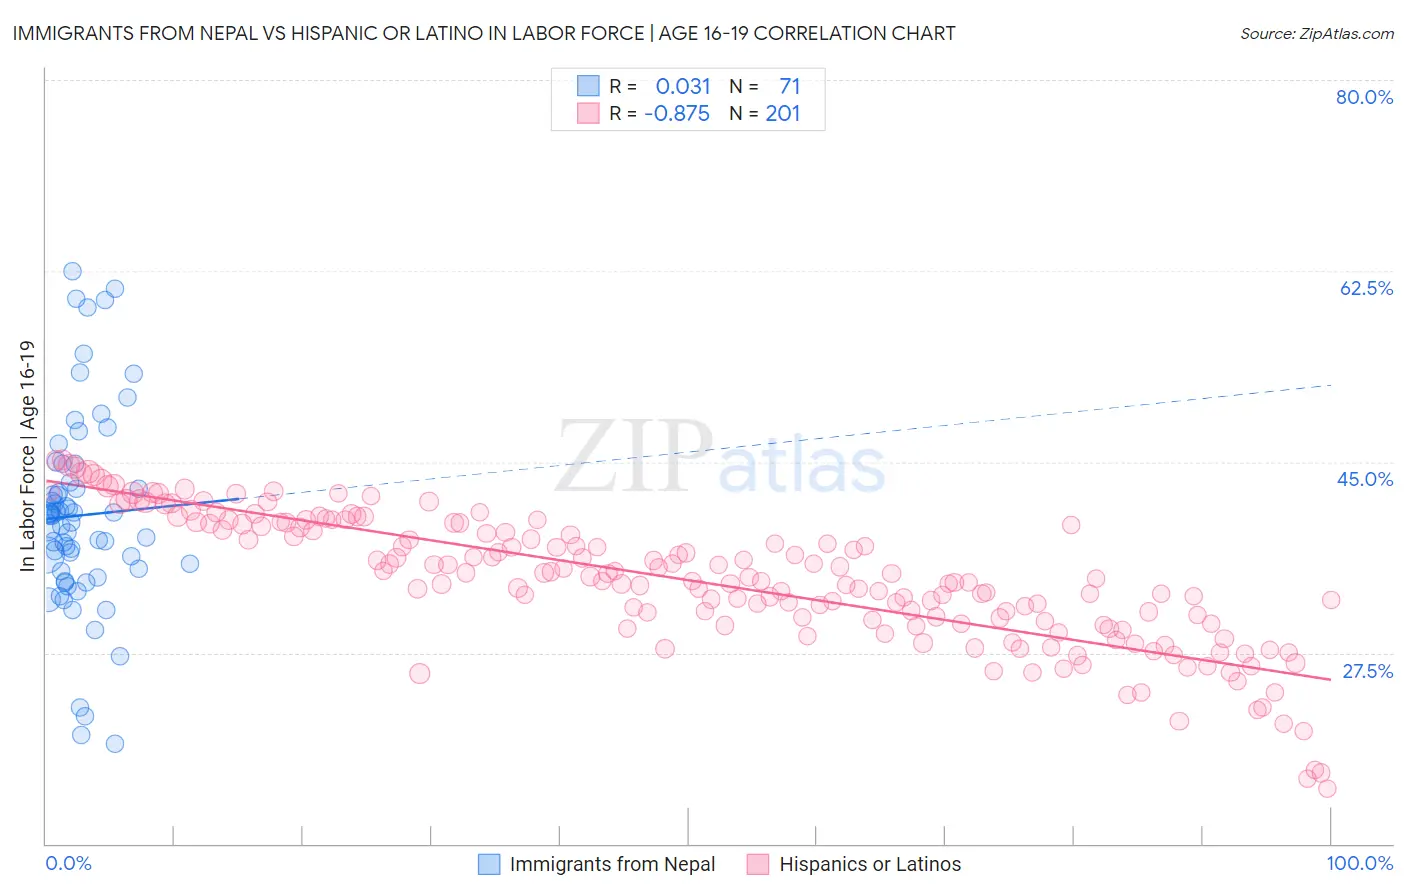
Immigrants from Nepal vs Hispanic or Latino In Labor Force | Age 16-19 Correlation Chart
The statistical analysis conducted on geographies consisting of 186,763,001 people shows no correlation between the proportion of Immigrants from Nepal and labor force participation rate among population between the ages 16 and 19 in the United States with a correlation coefficient (R) of 0.031 and weighted average of 38.3%. Similarly, the statistical analysis conducted on geographies consisting of 573,733,594 people shows a very strong negative correlation between the proportion of Hispanics or Latinos and labor force participation rate among population between the ages 16 and 19 in the United States with a correlation coefficient (R) of -0.875 and weighted average of 34.5%, a difference of 11.1%.
In Labor Force | Age 16-19 Correlation Summary
| Measurement | Immigrants from Nepal | Hispanic or Latino |
| Minimum | 19.2% | 15.0% |
| Maximum | 62.5% | 45.2% |
| Range | 43.3% | 30.2% |
| Mean | 40.1% | 34.1% |
| Median | 40.1% | 34.3% |
| Interquartile 25% (IQ1) | 35.0% | 30.2% |
| Interquartile 75% (IQ3) | 43.1% | 39.3% |
| Interquartile Range (IQR) | 8.1% | 9.1% |
| Standard Deviation (Sample) | 9.0% | 6.1% |
| Standard Deviation (Population) | 9.0% | 6.1% |
Similar Demographics by In Labor Force | Age 16-19
Demographics Similar to Immigrants from Nepal by In Labor Force | Age 16-19
In terms of in labor force | age 16-19, the demographic groups most similar to Immigrants from Nepal are Chickasaw (38.3%, a difference of 0.010%), Assyrian/Chaldean/Syriac (38.3%, a difference of 0.020%), Colville (38.3%, a difference of 0.060%), Bulgarian (38.3%, a difference of 0.070%), and Ukrainian (38.3%, a difference of 0.10%).
| Demographics | Rating | Rank | In Labor Force | Age 16-19 |
| Crow | 98.5 /100 | #111 | Exceptional 38.5% |
| Immigrants | Scotland | 98.5 /100 | #112 | Exceptional 38.5% |
| Sub-Saharan Africans | 98.3 /100 | #113 | Exceptional 38.4% |
| Hawaiians | 98.2 /100 | #114 | Exceptional 38.4% |
| Bulgarians | 97.9 /100 | #115 | Exceptional 38.3% |
| Colville | 97.9 /100 | #116 | Exceptional 38.3% |
| Chickasaw | 97.8 /100 | #117 | Exceptional 38.3% |
| Immigrants | Nepal | 97.8 /100 | #118 | Exceptional 38.3% |
| Assyrians/Chaldeans/Syriacs | 97.8 /100 | #119 | Exceptional 38.3% |
| Ukrainians | 97.6 /100 | #120 | Exceptional 38.3% |
| Ethiopians | 97.4 /100 | #121 | Exceptional 38.2% |
| Guamanians/Chamorros | 97.4 /100 | #122 | Exceptional 38.2% |
| Seminole | 96.7 /100 | #123 | Exceptional 38.1% |
| Immigrants | England | 96.4 /100 | #124 | Exceptional 38.1% |
| Immigrants | Africa | 96.1 /100 | #125 | Exceptional 38.0% |
Demographics Similar to Hispanics or Latinos by In Labor Force | Age 16-19
In terms of in labor force | age 16-19, the demographic groups most similar to Hispanics or Latinos are Salvadoran (34.5%, a difference of 0.010%), Burmese (34.5%, a difference of 0.040%), Egyptian (34.5%, a difference of 0.050%), Immigrants (34.6%, a difference of 0.13%), and Immigrants from Egypt (34.6%, a difference of 0.15%).
| Demographics | Rating | Rank | In Labor Force | Age 16-19 |
| Peruvians | 1.4 /100 | #255 | Tragic 34.6% |
| Immigrants | South Central Asia | 1.3 /100 | #256 | Tragic 34.6% |
| Immigrants | Egypt | 1.2 /100 | #257 | Tragic 34.6% |
| Thais | 1.2 /100 | #258 | Tragic 34.6% |
| Immigrants | Immigrants | 1.2 /100 | #259 | Tragic 34.6% |
| Egyptians | 1.2 /100 | #260 | Tragic 34.5% |
| Salvadorans | 1.1 /100 | #261 | Tragic 34.5% |
| Hispanics or Latinos | 1.1 /100 | #262 | Tragic 34.5% |
| Burmese | 1.1 /100 | #263 | Tragic 34.5% |
| Immigrants | Uruguay | 0.9 /100 | #264 | Tragic 34.4% |
| Immigrants | El Salvador | 0.7 /100 | #265 | Tragic 34.3% |
| Immigrants | Malaysia | 0.7 /100 | #266 | Tragic 34.3% |
| Immigrants | Peru | 0.5 /100 | #267 | Tragic 34.2% |
| Immigrants | Asia | 0.5 /100 | #268 | Tragic 34.1% |
| Pima | 0.5 /100 | #269 | Tragic 34.1% |