Palestinian vs Immigrants from Somalia In Labor Force | Age 30-34
COMPARE
Palestinian
Immigrants from Somalia
In Labor Force | Age 30-34
In Labor Force | Age 30-34 Comparison
Palestinians
Immigrants from Somalia
84.9%
IN LABOR FORCE | AGE 30-34
77.7/ 100
METRIC RATING
145th/ 347
METRIC RANK
86.2%
IN LABOR FORCE | AGE 30-34
100.0/ 100
METRIC RATING
9th/ 347
METRIC RANK
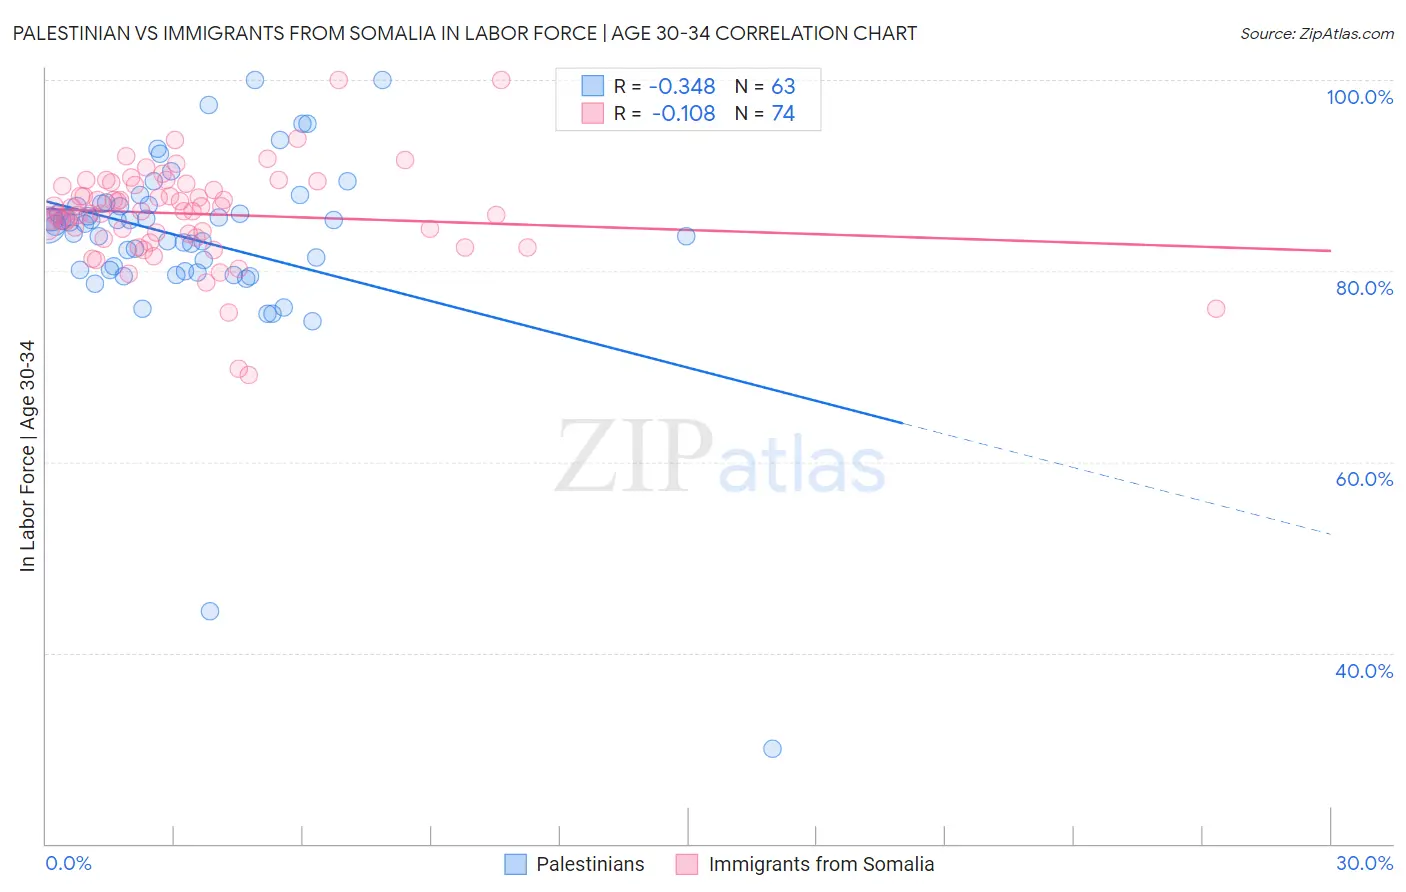
Palestinian vs Immigrants from Somalia In Labor Force | Age 30-34 Correlation Chart
The statistical analysis conducted on geographies consisting of 216,407,612 people shows a mild negative correlation between the proportion of Palestinians and labor force participation rate among population between the ages 30 and 34 in the United States with a correlation coefficient (R) of -0.348 and weighted average of 84.9%. Similarly, the statistical analysis conducted on geographies consisting of 92,106,685 people shows a poor negative correlation between the proportion of Immigrants from Somalia and labor force participation rate among population between the ages 30 and 34 in the United States with a correlation coefficient (R) of -0.108 and weighted average of 86.2%, a difference of 1.6%.
In Labor Force | Age 30-34 Correlation Summary
| Measurement | Palestinian | Immigrants from Somalia |
| Minimum | 30.0% | 69.1% |
| Maximum | 100.0% | 100.0% |
| Range | 70.0% | 30.9% |
| Mean | 83.4% | 86.0% |
| Median | 84.9% | 86.3% |
| Interquartile 25% (IQ1) | 80.1% | 83.5% |
| Interquartile 75% (IQ3) | 86.9% | 89.0% |
| Interquartile Range (IQR) | 6.8% | 5.5% |
| Standard Deviation (Sample) | 10.2% | 5.1% |
| Standard Deviation (Population) | 10.1% | 5.1% |
Similar Demographics by In Labor Force | Age 30-34
Demographics Similar to Palestinians by In Labor Force | Age 30-34
In terms of in labor force | age 30-34, the demographic groups most similar to Palestinians are Uruguayan (84.9%, a difference of 0.010%), Immigrants from Saudi Arabia (84.9%, a difference of 0.010%), Immigrants from Colombia (84.9%, a difference of 0.010%), Immigrants from Pakistan (84.9%, a difference of 0.010%), and Immigrants from Ukraine (84.8%, a difference of 0.020%).
| Demographics | Rating | Rank | In Labor Force | Age 30-34 |
| Sri Lankans | 87.8 /100 | #138 | Excellent 85.0% |
| Bhutanese | 87.5 /100 | #139 | Excellent 85.0% |
| Immigrants | Vietnam | 86.5 /100 | #140 | Excellent 85.0% |
| Chileans | 85.3 /100 | #141 | Excellent 84.9% |
| Immigrants | Indonesia | 84.3 /100 | #142 | Excellent 84.9% |
| Colombians | 82.2 /100 | #143 | Excellent 84.9% |
| Uruguayans | 78.5 /100 | #144 | Good 84.9% |
| Palestinians | 77.7 /100 | #145 | Good 84.9% |
| Immigrants | Saudi Arabia | 76.6 /100 | #146 | Good 84.9% |
| Immigrants | Colombia | 76.3 /100 | #147 | Good 84.9% |
| Immigrants | Pakistan | 76.2 /100 | #148 | Good 84.9% |
| Immigrants | Ukraine | 75.1 /100 | #149 | Good 84.8% |
| Germans | 75.1 /100 | #150 | Good 84.8% |
| Immigrants | Senegal | 74.0 /100 | #151 | Good 84.8% |
| Romanians | 73.5 /100 | #152 | Good 84.8% |
Demographics Similar to Immigrants from Somalia by In Labor Force | Age 30-34
In terms of in labor force | age 30-34, the demographic groups most similar to Immigrants from Somalia are Cambodian (86.2%, a difference of 0.010%), Immigrants from Bolivia (86.2%, a difference of 0.020%), Somali (86.2%, a difference of 0.040%), Immigrants from Serbia (86.2%, a difference of 0.040%), and Carpatho Rusyn (86.2%, a difference of 0.040%).
| Demographics | Rating | Rank | In Labor Force | Age 30-34 |
| Ethiopians | 100.0 /100 | #2 | Exceptional 86.6% |
| Immigrants | Ethiopia | 100.0 /100 | #3 | Exceptional 86.6% |
| Liberians | 100.0 /100 | #4 | Exceptional 86.4% |
| Immigrants | Ireland | 100.0 /100 | #5 | Exceptional 86.3% |
| Somalis | 100.0 /100 | #6 | Exceptional 86.2% |
| Immigrants | Bolivia | 100.0 /100 | #7 | Exceptional 86.2% |
| Cambodians | 100.0 /100 | #8 | Exceptional 86.2% |
| Immigrants | Somalia | 100.0 /100 | #9 | Exceptional 86.2% |
| Immigrants | Serbia | 100.0 /100 | #10 | Exceptional 86.2% |
| Carpatho Rusyns | 100.0 /100 | #11 | Exceptional 86.2% |
| Bolivians | 100.0 /100 | #12 | Exceptional 86.1% |
| Immigrants | Croatia | 100.0 /100 | #13 | Exceptional 86.1% |
| Immigrants | Cabo Verde | 100.0 /100 | #14 | Exceptional 86.1% |
| Immigrants | Albania | 100.0 /100 | #15 | Exceptional 86.1% |
| Latvians | 100.0 /100 | #16 | Exceptional 86.0% |