Immigrants from Middle Africa vs Immigrants from Western Europe In Labor Force | Age 45-54
COMPARE
Immigrants from Middle Africa
Immigrants from Western Europe
In Labor Force | Age 45-54
In Labor Force | Age 45-54 Comparison
Immigrants from Middle Africa
Immigrants from Western Europe
83.3%
IN LABOR FORCE | AGE 45-54
94.3/ 100
METRIC RATING
99th/ 347
METRIC RANK
82.4%
IN LABOR FORCE | AGE 45-54
10.9/ 100
METRIC RATING
204th/ 347
METRIC RANK
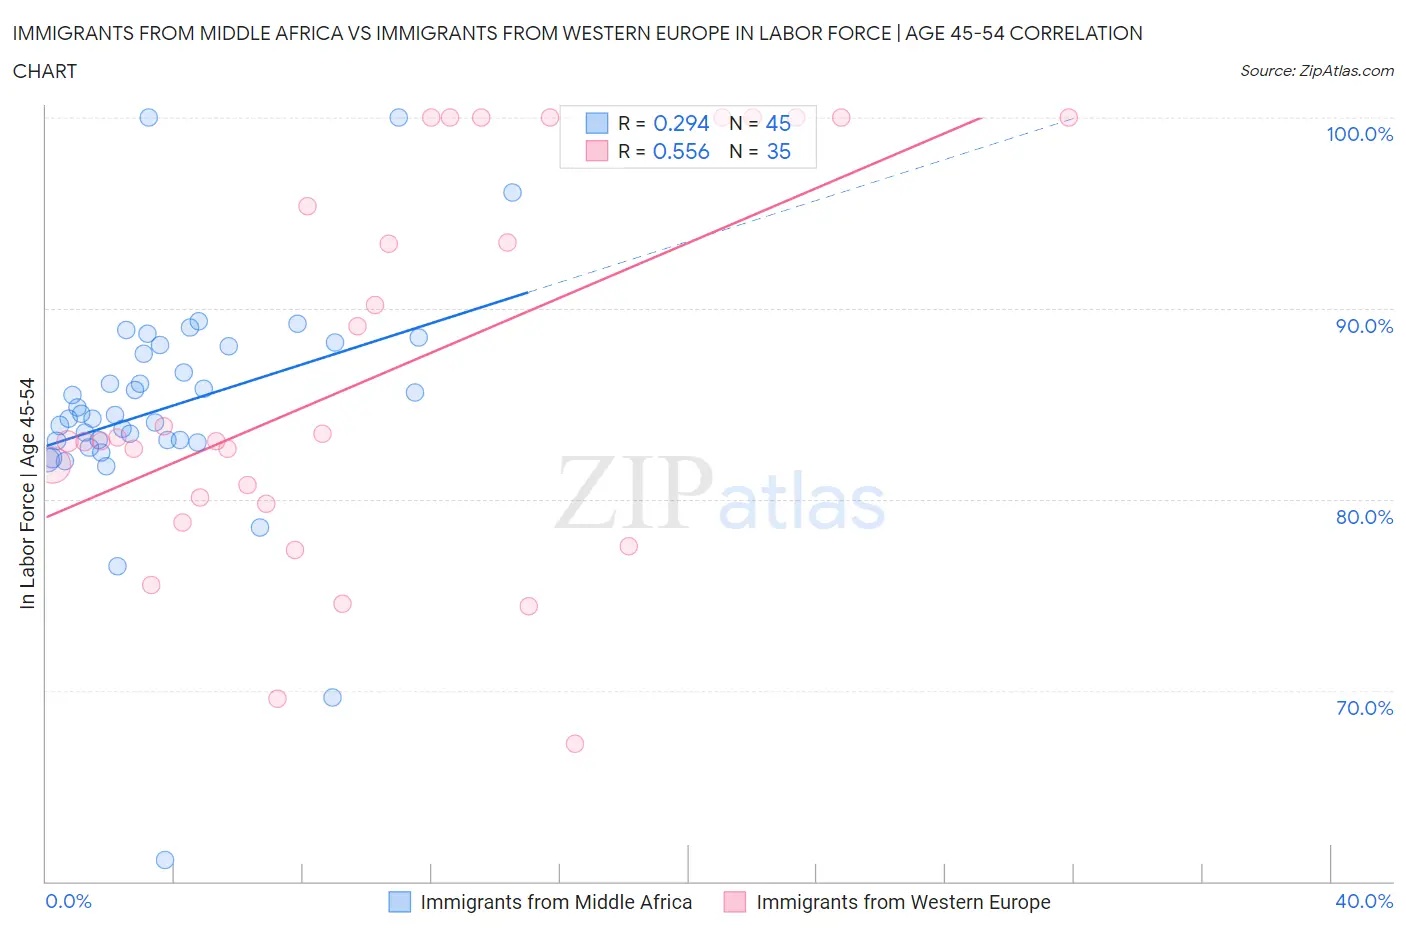
Immigrants from Middle Africa vs Immigrants from Western Europe In Labor Force | Age 45-54 Correlation Chart
The statistical analysis conducted on geographies consisting of 202,639,342 people shows a weak positive correlation between the proportion of Immigrants from Middle Africa and labor force participation rate among population between the ages 45 and 54 in the United States with a correlation coefficient (R) of 0.294 and weighted average of 83.3%. Similarly, the statistical analysis conducted on geographies consisting of 493,798,681 people shows a substantial positive correlation between the proportion of Immigrants from Western Europe and labor force participation rate among population between the ages 45 and 54 in the United States with a correlation coefficient (R) of 0.556 and weighted average of 82.4%, a difference of 1.1%.
In Labor Force | Age 45-54 Correlation Summary
| Measurement | Immigrants from Middle Africa | Immigrants from Western Europe |
| Minimum | 61.1% | 67.2% |
| Maximum | 100.0% | 100.0% |
| Range | 38.9% | 32.8% |
| Mean | 84.8% | 86.5% |
| Median | 84.4% | 83.1% |
| Interquartile 25% (IQ1) | 83.0% | 79.8% |
| Interquartile 75% (IQ3) | 88.0% | 100.0% |
| Interquartile Range (IQR) | 5.0% | 20.2% |
| Standard Deviation (Sample) | 6.2% | 10.0% |
| Standard Deviation (Population) | 6.2% | 9.8% |
Similar Demographics by In Labor Force | Age 45-54
Demographics Similar to Immigrants from Middle Africa by In Labor Force | Age 45-54
In terms of in labor force | age 45-54, the demographic groups most similar to Immigrants from Middle Africa are Mongolian (83.3%, a difference of 0.0%), Maltese (83.3%, a difference of 0.010%), Immigrants from Belarus (83.3%, a difference of 0.010%), Immigrants from Singapore (83.3%, a difference of 0.010%), and Albanian (83.3%, a difference of 0.010%).
| Demographics | Rating | Rank | In Labor Force | Age 45-54 |
| Danes | 95.3 /100 | #92 | Exceptional 83.3% |
| Italians | 95.1 /100 | #93 | Exceptional 83.3% |
| Argentineans | 94.9 /100 | #94 | Exceptional 83.3% |
| Immigrants | Argentina | 94.9 /100 | #95 | Exceptional 83.3% |
| Immigrants | Kuwait | 94.8 /100 | #96 | Exceptional 83.3% |
| Palestinians | 94.8 /100 | #97 | Exceptional 83.3% |
| Maltese | 94.4 /100 | #98 | Exceptional 83.3% |
| Immigrants | Middle Africa | 94.3 /100 | #99 | Exceptional 83.3% |
| Mongolians | 94.2 /100 | #100 | Exceptional 83.3% |
| Immigrants | Belarus | 94.1 /100 | #101 | Exceptional 83.3% |
| Immigrants | Singapore | 93.9 /100 | #102 | Exceptional 83.3% |
| Albanians | 93.9 /100 | #103 | Exceptional 83.3% |
| Immigrants | Romania | 93.8 /100 | #104 | Exceptional 83.3% |
| Immigrants | South America | 93.5 /100 | #105 | Exceptional 83.2% |
| Sri Lankans | 93.2 /100 | #106 | Exceptional 83.2% |
Demographics Similar to Immigrants from Western Europe by In Labor Force | Age 45-54
In terms of in labor force | age 45-54, the demographic groups most similar to Immigrants from Western Europe are Arab (82.4%, a difference of 0.010%), Senegalese (82.4%, a difference of 0.030%), Welsh (82.3%, a difference of 0.040%), Immigrants from Cabo Verde (82.3%, a difference of 0.060%), and Native Hawaiian (82.3%, a difference of 0.060%).
| Demographics | Rating | Rank | In Labor Force | Age 45-54 |
| Lebanese | 18.2 /100 | #197 | Poor 82.5% |
| Immigrants | Denmark | 17.9 /100 | #198 | Poor 82.5% |
| Moroccans | 15.7 /100 | #199 | Poor 82.5% |
| French Canadians | 15.4 /100 | #200 | Poor 82.5% |
| Canadians | 15.1 /100 | #201 | Poor 82.4% |
| Immigrants | Western Asia | 14.9 /100 | #202 | Poor 82.4% |
| Arabs | 11.6 /100 | #203 | Poor 82.4% |
| Immigrants | Western Europe | 10.9 /100 | #204 | Poor 82.4% |
| Senegalese | 9.5 /100 | #205 | Tragic 82.4% |
| Welsh | 9.2 /100 | #206 | Tragic 82.3% |
| Immigrants | Cabo Verde | 8.6 /100 | #207 | Tragic 82.3% |
| Native Hawaiians | 8.5 /100 | #208 | Tragic 82.3% |
| Immigrants | Lebanon | 7.4 /100 | #209 | Tragic 82.3% |
| Immigrants | Bahamas | 7.1 /100 | #210 | Tragic 82.3% |
| Immigrants | Syria | 6.6 /100 | #211 | Tragic 82.3% |