Immigrants from Middle Africa vs Immigrants In Labor Force | Age 45-54
COMPARE
Immigrants from Middle Africa
Immigrants
In Labor Force | Age 45-54
In Labor Force | Age 45-54 Comparison
Immigrants from Middle Africa
Immigrants
83.3%
IN LABOR FORCE | AGE 45-54
94.3/ 100
METRIC RATING
99th/ 347
METRIC RANK
82.1%
IN LABOR FORCE | AGE 45-54
3.1/ 100
METRIC RATING
223rd/ 347
METRIC RANK
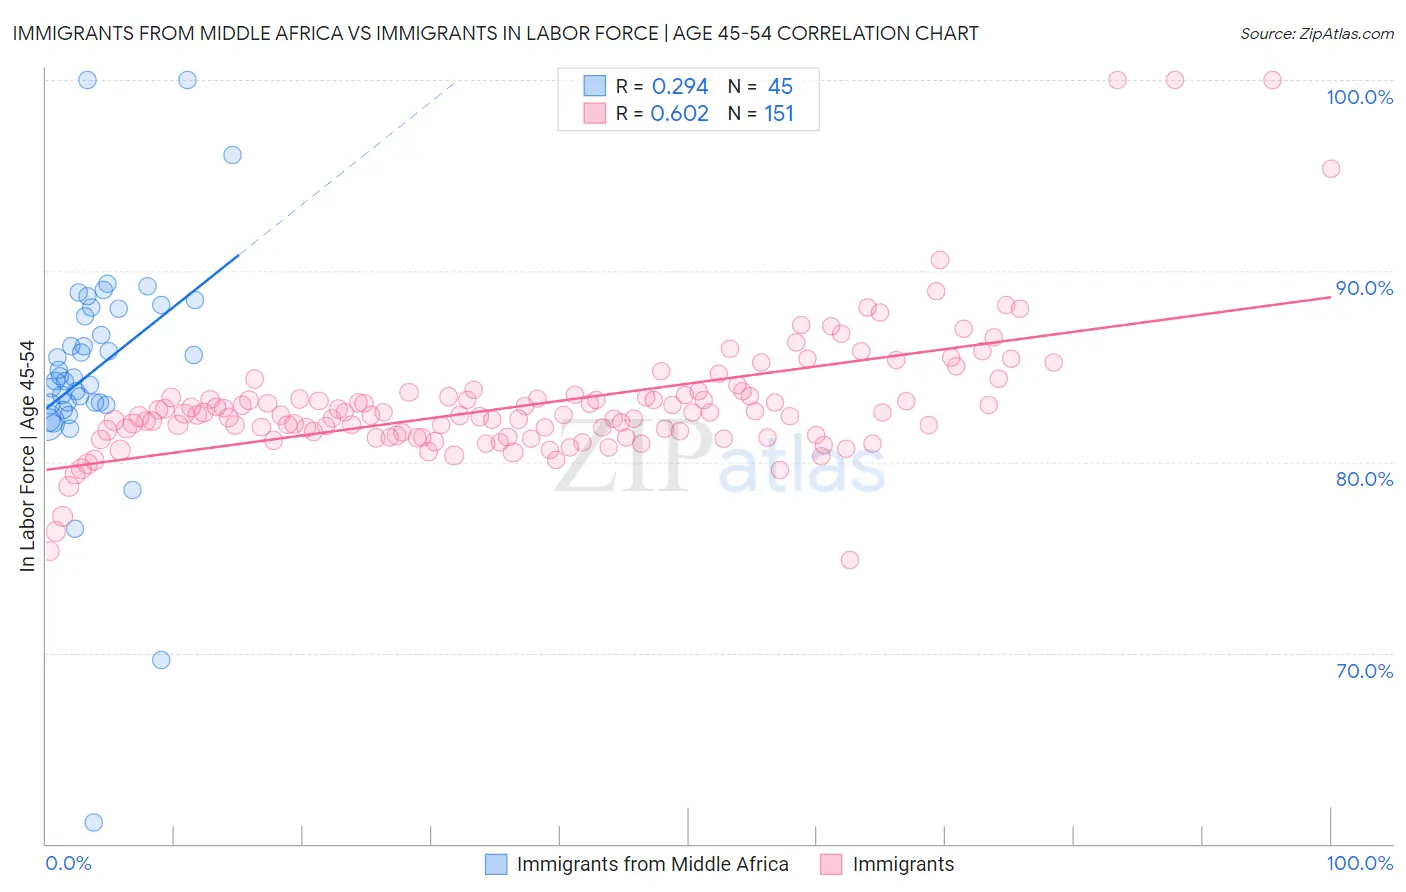
Immigrants from Middle Africa vs Immigrants In Labor Force | Age 45-54 Correlation Chart
The statistical analysis conducted on geographies consisting of 202,639,342 people shows a weak positive correlation between the proportion of Immigrants from Middle Africa and labor force participation rate among population between the ages 45 and 54 in the United States with a correlation coefficient (R) of 0.294 and weighted average of 83.3%. Similarly, the statistical analysis conducted on geographies consisting of 576,883,535 people shows a significant positive correlation between the proportion of Immigrants and labor force participation rate among population between the ages 45 and 54 in the United States with a correlation coefficient (R) of 0.602 and weighted average of 82.1%, a difference of 1.4%.
In Labor Force | Age 45-54 Correlation Summary
| Measurement | Immigrants from Middle Africa | Immigrants |
| Minimum | 61.1% | 74.9% |
| Maximum | 100.0% | 100.0% |
| Range | 38.9% | 25.1% |
| Mean | 84.8% | 83.1% |
| Median | 84.4% | 82.5% |
| Interquartile 25% (IQ1) | 83.0% | 81.3% |
| Interquartile 75% (IQ3) | 88.0% | 83.4% |
| Interquartile Range (IQR) | 5.0% | 2.1% |
| Standard Deviation (Sample) | 6.2% | 3.5% |
| Standard Deviation (Population) | 6.2% | 3.5% |
Similar Demographics by In Labor Force | Age 45-54
Demographics Similar to Immigrants from Middle Africa by In Labor Force | Age 45-54
In terms of in labor force | age 45-54, the demographic groups most similar to Immigrants from Middle Africa are Mongolian (83.3%, a difference of 0.0%), Maltese (83.3%, a difference of 0.010%), Immigrants from Belarus (83.3%, a difference of 0.010%), Immigrants from Singapore (83.3%, a difference of 0.010%), and Albanian (83.3%, a difference of 0.010%).
| Demographics | Rating | Rank | In Labor Force | Age 45-54 |
| Danes | 95.3 /100 | #92 | Exceptional 83.3% |
| Italians | 95.1 /100 | #93 | Exceptional 83.3% |
| Argentineans | 94.9 /100 | #94 | Exceptional 83.3% |
| Immigrants | Argentina | 94.9 /100 | #95 | Exceptional 83.3% |
| Immigrants | Kuwait | 94.8 /100 | #96 | Exceptional 83.3% |
| Palestinians | 94.8 /100 | #97 | Exceptional 83.3% |
| Maltese | 94.4 /100 | #98 | Exceptional 83.3% |
| Immigrants | Middle Africa | 94.3 /100 | #99 | Exceptional 83.3% |
| Mongolians | 94.2 /100 | #100 | Exceptional 83.3% |
| Immigrants | Belarus | 94.1 /100 | #101 | Exceptional 83.3% |
| Immigrants | Singapore | 93.9 /100 | #102 | Exceptional 83.3% |
| Albanians | 93.9 /100 | #103 | Exceptional 83.3% |
| Immigrants | Romania | 93.8 /100 | #104 | Exceptional 83.3% |
| Immigrants | South America | 93.5 /100 | #105 | Exceptional 83.2% |
| Sri Lankans | 93.2 /100 | #106 | Exceptional 83.2% |
Demographics Similar to Immigrants by In Labor Force | Age 45-54
In terms of in labor force | age 45-54, the demographic groups most similar to Immigrants are Panamanian (82.2%, a difference of 0.020%), Immigrants from Ecuador (82.2%, a difference of 0.020%), Bahamian (82.2%, a difference of 0.030%), Immigrants from Jamaica (82.1%, a difference of 0.030%), and Immigrants from Oceania (82.1%, a difference of 0.050%).
| Demographics | Rating | Rank | In Labor Force | Age 45-54 |
| Scottish | 5.3 /100 | #216 | Tragic 82.2% |
| Portuguese | 4.7 /100 | #217 | Tragic 82.2% |
| English | 4.4 /100 | #218 | Tragic 82.2% |
| French | 4.1 /100 | #219 | Tragic 82.2% |
| Bahamians | 3.6 /100 | #220 | Tragic 82.2% |
| Panamanians | 3.5 /100 | #221 | Tragic 82.2% |
| Immigrants | Ecuador | 3.4 /100 | #222 | Tragic 82.2% |
| Immigrants | Immigrants | 3.1 /100 | #223 | Tragic 82.1% |
| Immigrants | Jamaica | 2.7 /100 | #224 | Tragic 82.1% |
| Immigrants | Oceania | 2.5 /100 | #225 | Tragic 82.1% |
| Immigrants | Caribbean | 2.5 /100 | #226 | Tragic 82.1% |
| Immigrants | Germany | 2.4 /100 | #227 | Tragic 82.1% |
| Cape Verdeans | 2.1 /100 | #228 | Tragic 82.1% |
| Immigrants | Burma/Myanmar | 1.9 /100 | #229 | Tragic 82.0% |
| Jamaicans | 1.8 /100 | #230 | Tragic 82.0% |