Okinawan vs Immigrants from Turkey In Labor Force | Age > 16
COMPARE
Okinawan
Immigrants from Turkey
In Labor Force | Age > 16
In Labor Force | Age > 16 Comparison
Okinawans
Immigrants from Turkey
65.9%
IN LABOR FORCE | AGE > 16
98.7/ 100
METRIC RATING
100th/ 347
METRIC RANK
66.3%
IN LABOR FORCE | AGE > 16
99.9/ 100
METRIC RATING
59th/ 347
METRIC RANK
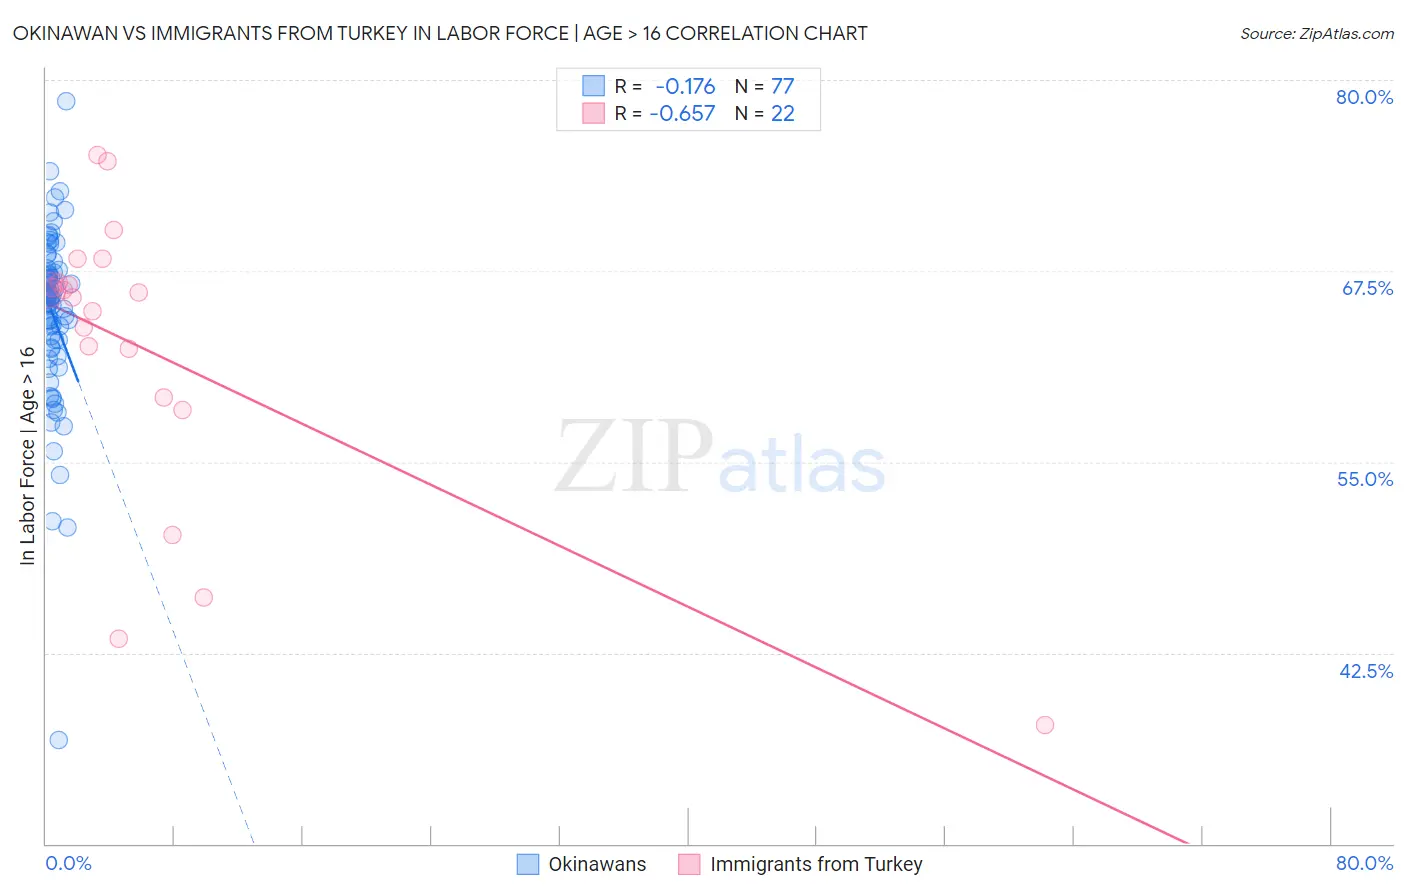
Okinawan vs Immigrants from Turkey In Labor Force | Age > 16 Correlation Chart
The statistical analysis conducted on geographies consisting of 73,766,468 people shows a poor negative correlation between the proportion of Okinawans and labor force participation rate among population ages 16 and over in the United States with a correlation coefficient (R) of -0.176 and weighted average of 65.9%. Similarly, the statistical analysis conducted on geographies consisting of 223,052,786 people shows a significant negative correlation between the proportion of Immigrants from Turkey and labor force participation rate among population ages 16 and over in the United States with a correlation coefficient (R) of -0.657 and weighted average of 66.3%, a difference of 0.63%.
In Labor Force | Age > 16 Correlation Summary
| Measurement | Okinawan | Immigrants from Turkey |
| Minimum | 36.8% | 37.8% |
| Maximum | 78.6% | 75.1% |
| Range | 41.8% | 37.3% |
| Mean | 64.6% | 62.2% |
| Median | 65.7% | 65.9% |
| Interquartile 25% (IQ1) | 62.5% | 59.2% |
| Interquartile 75% (IQ3) | 67.5% | 66.7% |
| Interquartile Range (IQR) | 5.0% | 7.5% |
| Standard Deviation (Sample) | 5.8% | 9.7% |
| Standard Deviation (Population) | 5.8% | 9.5% |
Similar Demographics by In Labor Force | Age > 16
Demographics Similar to Okinawans by In Labor Force | Age > 16
In terms of in labor force | age > 16, the demographic groups most similar to Okinawans are Immigrants from Australia (65.9%, a difference of 0.0%), Immigrants from Colombia (65.9%, a difference of 0.010%), Uruguayan (65.9%, a difference of 0.010%), Immigrants from Chile (65.9%, a difference of 0.020%), and Immigrants from South Eastern Asia (65.9%, a difference of 0.030%).
| Demographics | Rating | Rank | In Labor Force | Age > 16 |
| Immigrants | South America | 99.1 /100 | #93 | Exceptional 66.0% |
| Immigrants | Cambodia | 99.1 /100 | #94 | Exceptional 66.0% |
| Immigrants | Uruguay | 99.1 /100 | #95 | Exceptional 66.0% |
| Bangladeshis | 98.9 /100 | #96 | Exceptional 65.9% |
| Filipinos | 98.9 /100 | #97 | Exceptional 65.9% |
| Immigrants | Chile | 98.7 /100 | #98 | Exceptional 65.9% |
| Immigrants | Australia | 98.7 /100 | #99 | Exceptional 65.9% |
| Okinawans | 98.7 /100 | #100 | Exceptional 65.9% |
| Immigrants | Colombia | 98.6 /100 | #101 | Exceptional 65.9% |
| Uruguayans | 98.6 /100 | #102 | Exceptional 65.9% |
| Immigrants | South Eastern Asia | 98.5 /100 | #103 | Exceptional 65.9% |
| Palestinians | 98.5 /100 | #104 | Exceptional 65.9% |
| Colombians | 98.4 /100 | #105 | Exceptional 65.9% |
| Immigrants | Serbia | 98.1 /100 | #106 | Exceptional 65.8% |
| Immigrants | Poland | 98.1 /100 | #107 | Exceptional 65.8% |
Demographics Similar to Immigrants from Turkey by In Labor Force | Age > 16
In terms of in labor force | age > 16, the demographic groups most similar to Immigrants from Turkey are Immigrants from Saudi Arabia (66.3%, a difference of 0.020%), Immigrants from Peru (66.3%, a difference of 0.020%), Immigrants from Burma/Myanmar (66.3%, a difference of 0.030%), Indonesian (66.3%, a difference of 0.030%), and Venezuelan (66.3%, a difference of 0.060%).
| Demographics | Rating | Rank | In Labor Force | Age > 16 |
| Paraguayans | 99.9 /100 | #52 | Exceptional 66.5% |
| Immigrants | Sri Lanka | 99.9 /100 | #53 | Exceptional 66.5% |
| Immigrants | Bosnia and Herzegovina | 99.9 /100 | #54 | Exceptional 66.5% |
| Immigrants | Venezuela | 99.9 /100 | #55 | Exceptional 66.4% |
| Immigrants | Senegal | 99.9 /100 | #56 | Exceptional 66.4% |
| Bulgarians | 99.9 /100 | #57 | Exceptional 66.4% |
| Immigrants | Saudi Arabia | 99.9 /100 | #58 | Exceptional 66.3% |
| Immigrants | Turkey | 99.9 /100 | #59 | Exceptional 66.3% |
| Immigrants | Peru | 99.8 /100 | #60 | Exceptional 66.3% |
| Immigrants | Burma/Myanmar | 99.8 /100 | #61 | Exceptional 66.3% |
| Indonesians | 99.8 /100 | #62 | Exceptional 66.3% |
| Venezuelans | 99.8 /100 | #63 | Exceptional 66.3% |
| Peruvians | 99.8 /100 | #64 | Exceptional 66.3% |
| Sri Lankans | 99.8 /100 | #65 | Exceptional 66.3% |
| Jordanians | 99.8 /100 | #66 | Exceptional 66.3% |