Immigrants from Micronesia vs Immigrants from Colombia In Labor Force | Age 25-29
COMPARE
Immigrants from Micronesia
Immigrants from Colombia
In Labor Force | Age 25-29
In Labor Force | Age 25-29 Comparison
Immigrants from Micronesia
Immigrants from Colombia
83.0%
IN LABOR FORCE | AGE 25-29
0.0/ 100
METRIC RATING
289th/ 347
METRIC RANK
84.7%
IN LABOR FORCE | AGE 25-29
58.3/ 100
METRIC RATING
162nd/ 347
METRIC RANK
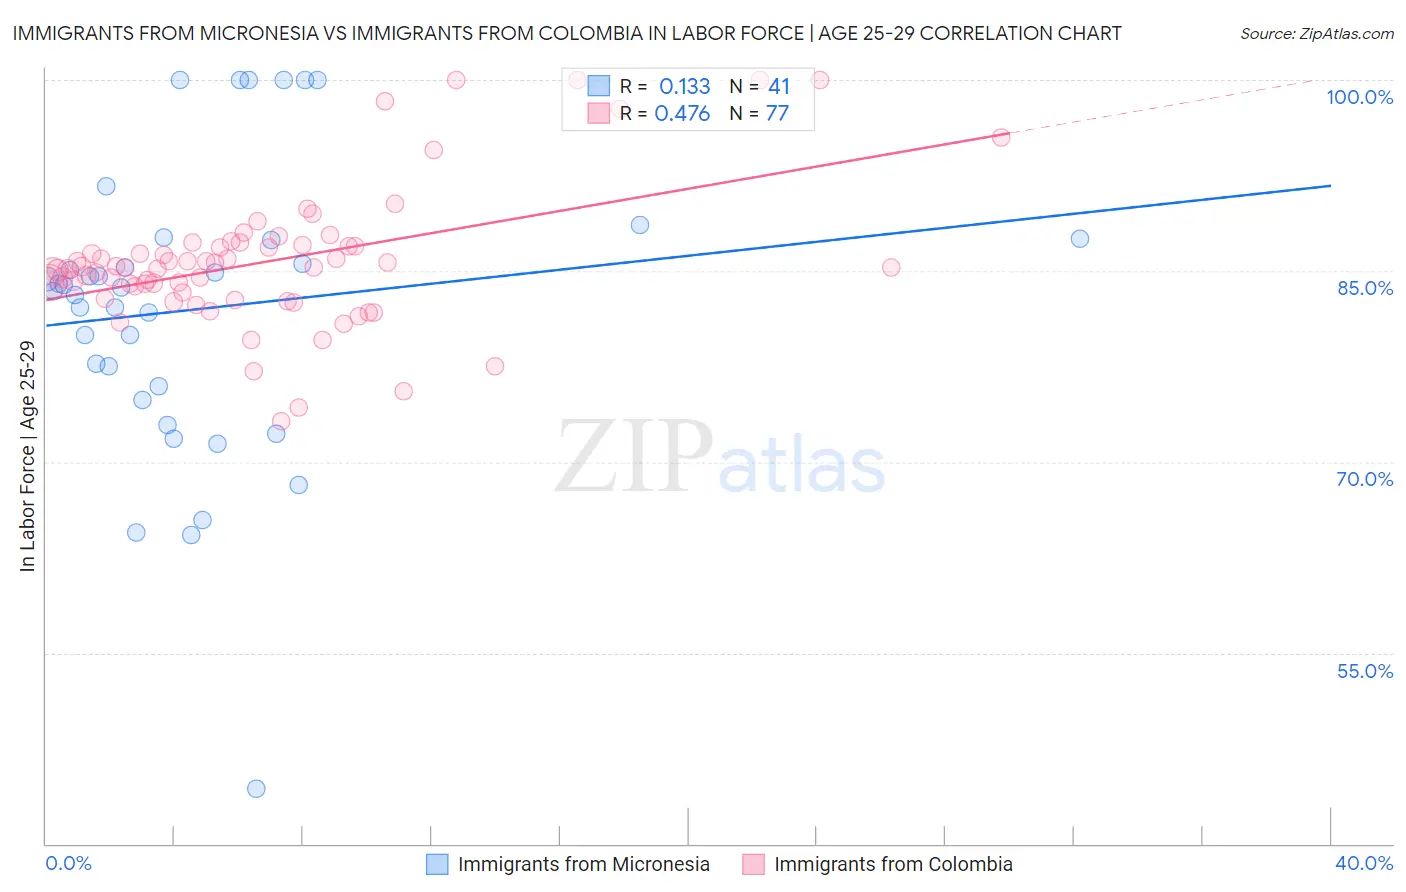
Immigrants from Micronesia vs Immigrants from Colombia In Labor Force | Age 25-29 Correlation Chart
The statistical analysis conducted on geographies consisting of 61,602,386 people shows a poor positive correlation between the proportion of Immigrants from Micronesia and labor force participation rate among population between the ages 25 and 29 in the United States with a correlation coefficient (R) of 0.133 and weighted average of 83.0%. Similarly, the statistical analysis conducted on geographies consisting of 378,572,642 people shows a moderate positive correlation between the proportion of Immigrants from Colombia and labor force participation rate among population between the ages 25 and 29 in the United States with a correlation coefficient (R) of 0.476 and weighted average of 84.7%, a difference of 2.1%.
In Labor Force | Age 25-29 Correlation Summary
| Measurement | Immigrants from Micronesia | Immigrants from Colombia |
| Minimum | 44.3% | 73.2% |
| Maximum | 100.0% | 100.0% |
| Range | 55.7% | 26.8% |
| Mean | 82.0% | 85.8% |
| Median | 83.7% | 85.3% |
| Interquartile 25% (IQ1) | 75.4% | 83.1% |
| Interquartile 75% (IQ3) | 87.4% | 87.0% |
| Interquartile Range (IQR) | 12.0% | 3.9% |
| Standard Deviation (Sample) | 11.5% | 5.4% |
| Standard Deviation (Population) | 11.4% | 5.3% |
Similar Demographics by In Labor Force | Age 25-29
Demographics Similar to Immigrants from Micronesia by In Labor Force | Age 25-29
In terms of in labor force | age 25-29, the demographic groups most similar to Immigrants from Micronesia are Ottawa (83.0%, a difference of 0.020%), Immigrants from Bangladesh (83.0%, a difference of 0.030%), Hawaiian (83.0%, a difference of 0.030%), Guyanese (83.0%, a difference of 0.050%), and Immigrants from Guyana (83.0%, a difference of 0.050%).
| Demographics | Rating | Rank | In Labor Force | Age 25-29 |
| Americans | 0.0 /100 | #282 | Tragic 83.1% |
| Immigrants | Azores | 0.0 /100 | #283 | Tragic 83.1% |
| Nicaraguans | 0.0 /100 | #284 | Tragic 83.1% |
| Belizeans | 0.0 /100 | #285 | Tragic 83.1% |
| Mexican American Indians | 0.0 /100 | #286 | Tragic 83.0% |
| Guyanese | 0.0 /100 | #287 | Tragic 83.0% |
| Ottawa | 0.0 /100 | #288 | Tragic 83.0% |
| Immigrants | Micronesia | 0.0 /100 | #289 | Tragic 83.0% |
| Immigrants | Bangladesh | 0.0 /100 | #290 | Tragic 83.0% |
| Hawaiians | 0.0 /100 | #291 | Tragic 83.0% |
| Immigrants | Guyana | 0.0 /100 | #292 | Tragic 83.0% |
| Immigrants | Latin America | 0.0 /100 | #293 | Tragic 82.9% |
| Nepalese | 0.0 /100 | #294 | Tragic 82.9% |
| Chippewa | 0.0 /100 | #295 | Tragic 82.9% |
| Immigrants | Nicaragua | 0.0 /100 | #296 | Tragic 82.9% |
Demographics Similar to Immigrants from Colombia by In Labor Force | Age 25-29
In terms of in labor force | age 25-29, the demographic groups most similar to Immigrants from Colombia are Immigrants from Peru (84.7%, a difference of 0.0%), Canadian (84.7%, a difference of 0.0%), Argentinean (84.7%, a difference of 0.0%), Ghanaian (84.7%, a difference of 0.0%), and Immigrants from Ghana (84.7%, a difference of 0.010%).
| Demographics | Rating | Rank | In Labor Force | Age 25-29 |
| Indians (Asian) | 61.6 /100 | #155 | Good 84.7% |
| French | 61.0 /100 | #156 | Good 84.7% |
| British | 60.4 /100 | #157 | Good 84.7% |
| Immigrants | Ghana | 60.2 /100 | #158 | Good 84.7% |
| Immigrants | Western Africa | 60.1 /100 | #159 | Good 84.7% |
| Immigrants | Peru | 58.6 /100 | #160 | Average 84.7% |
| Canadians | 58.5 /100 | #161 | Average 84.7% |
| Immigrants | Colombia | 58.3 /100 | #162 | Average 84.7% |
| Argentineans | 57.9 /100 | #163 | Average 84.7% |
| Ghanaians | 57.6 /100 | #164 | Average 84.7% |
| Immigrants | Burma/Myanmar | 57.4 /100 | #165 | Average 84.7% |
| Immigrants | Spain | 56.9 /100 | #166 | Average 84.7% |
| Indonesians | 56.5 /100 | #167 | Average 84.7% |
| South Americans | 54.9 /100 | #168 | Average 84.7% |
| Celtics | 52.5 /100 | #169 | Average 84.7% |