Immigrants from Philippines vs Immigrants from Morocco In Labor Force | Age 25-29
COMPARE
Immigrants from Philippines
Immigrants from Morocco
In Labor Force | Age 25-29
In Labor Force | Age 25-29 Comparison
Immigrants from Philippines
Immigrants from Morocco
84.2%
IN LABOR FORCE | AGE 25-29
4.7/ 100
METRIC RATING
231st/ 347
METRIC RANK
85.5%
IN LABOR FORCE | AGE 25-29
99.5/ 100
METRIC RATING
59th/ 347
METRIC RANK
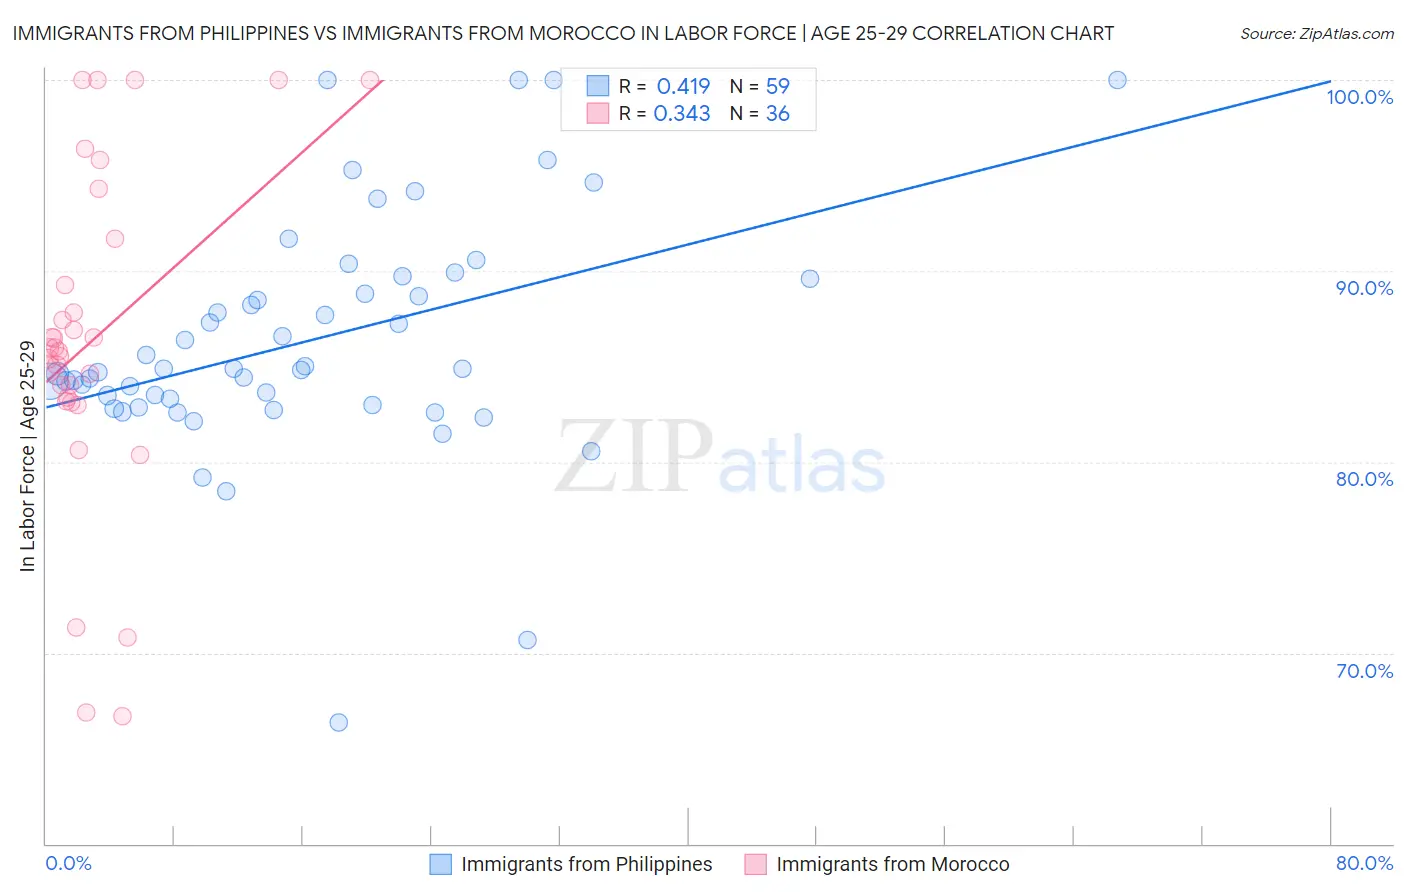
Immigrants from Philippines vs Immigrants from Morocco In Labor Force | Age 25-29 Correlation Chart
The statistical analysis conducted on geographies consisting of 471,084,239 people shows a moderate positive correlation between the proportion of Immigrants from Philippines and labor force participation rate among population between the ages 25 and 29 in the United States with a correlation coefficient (R) of 0.419 and weighted average of 84.2%. Similarly, the statistical analysis conducted on geographies consisting of 178,899,306 people shows a mild positive correlation between the proportion of Immigrants from Morocco and labor force participation rate among population between the ages 25 and 29 in the United States with a correlation coefficient (R) of 0.343 and weighted average of 85.5%, a difference of 1.5%.
In Labor Force | Age 25-29 Correlation Summary
| Measurement | Immigrants from Philippines | Immigrants from Morocco |
| Minimum | 66.4% | 66.7% |
| Maximum | 100.0% | 100.0% |
| Range | 33.6% | 33.3% |
| Mean | 86.4% | 86.4% |
| Median | 84.9% | 85.9% |
| Interquartile 25% (IQ1) | 83.0% | 83.3% |
| Interquartile 75% (IQ3) | 89.6% | 90.5% |
| Interquartile Range (IQR) | 6.6% | 7.2% |
| Standard Deviation (Sample) | 6.2% | 8.6% |
| Standard Deviation (Population) | 6.2% | 8.5% |
Similar Demographics by In Labor Force | Age 25-29
Demographics Similar to Immigrants from Philippines by In Labor Force | Age 25-29
In terms of in labor force | age 25-29, the demographic groups most similar to Immigrants from Philippines are Immigrants from Oceania (84.2%, a difference of 0.010%), White/Caucasian (84.2%, a difference of 0.010%), Panamanian (84.2%, a difference of 0.010%), French American Indian (84.2%, a difference of 0.030%), and Immigrants from Panama (84.2%, a difference of 0.030%).
| Demographics | Rating | Rank | In Labor Force | Age 25-29 |
| Immigrants | West Indies | 6.0 /100 | #224 | Tragic 84.2% |
| Koreans | 5.9 /100 | #225 | Tragic 84.2% |
| Immigrants | Congo | 5.8 /100 | #226 | Tragic 84.2% |
| French American Indians | 5.5 /100 | #227 | Tragic 84.2% |
| Immigrants | Panama | 5.5 /100 | #228 | Tragic 84.2% |
| Immigrants | Oceania | 5.0 /100 | #229 | Tragic 84.2% |
| Whites/Caucasians | 4.8 /100 | #230 | Tragic 84.2% |
| Immigrants | Philippines | 4.7 /100 | #231 | Tragic 84.2% |
| Panamanians | 4.5 /100 | #232 | Tragic 84.2% |
| Immigrants | Western Asia | 2.7 /100 | #233 | Tragic 84.1% |
| Barbadians | 1.0 /100 | #234 | Tragic 83.9% |
| Iraqis | 0.9 /100 | #235 | Tragic 83.9% |
| Guamanians/Chamorros | 0.9 /100 | #236 | Tragic 83.9% |
| Immigrants | Immigrants | 0.9 /100 | #237 | Tragic 83.9% |
| Immigrants | Uzbekistan | 0.8 /100 | #238 | Tragic 83.9% |
Demographics Similar to Immigrants from Morocco by In Labor Force | Age 25-29
In terms of in labor force | age 25-29, the demographic groups most similar to Immigrants from Morocco are Estonian (85.5%, a difference of 0.010%), Greek (85.5%, a difference of 0.010%), Eastern European (85.5%, a difference of 0.020%), Thai (85.5%, a difference of 0.030%), and Serbian (85.5%, a difference of 0.030%).
| Demographics | Rating | Rank | In Labor Force | Age 25-29 |
| Immigrants | Poland | 99.7 /100 | #52 | Exceptional 85.6% |
| Belgians | 99.7 /100 | #53 | Exceptional 85.5% |
| Albanians | 99.7 /100 | #54 | Exceptional 85.5% |
| Immigrants | Brazil | 99.7 /100 | #55 | Exceptional 85.5% |
| Eastern Europeans | 99.6 /100 | #56 | Exceptional 85.5% |
| Estonians | 99.6 /100 | #57 | Exceptional 85.5% |
| Greeks | 99.6 /100 | #58 | Exceptional 85.5% |
| Immigrants | Morocco | 99.5 /100 | #59 | Exceptional 85.5% |
| Thais | 99.5 /100 | #60 | Exceptional 85.5% |
| Serbians | 99.5 /100 | #61 | Exceptional 85.5% |
| Taiwanese | 99.4 /100 | #62 | Exceptional 85.4% |
| Immigrants | Kenya | 99.4 /100 | #63 | Exceptional 85.4% |
| Immigrants | Italy | 99.3 /100 | #64 | Exceptional 85.4% |
| Immigrants | Czechoslovakia | 99.3 /100 | #65 | Exceptional 85.4% |
| Immigrants | Scotland | 99.3 /100 | #66 | Exceptional 85.4% |