Immigrants from Micronesia vs Immigrants from Belgium In Labor Force | Age 25-29
COMPARE
Immigrants from Micronesia
Immigrants from Belgium
In Labor Force | Age 25-29
In Labor Force | Age 25-29 Comparison
Immigrants from Micronesia
Immigrants from Belgium
83.0%
IN LABOR FORCE | AGE 25-29
0.0/ 100
METRIC RATING
289th/ 347
METRIC RANK
84.6%
IN LABOR FORCE | AGE 25-29
35.0/ 100
METRIC RATING
186th/ 347
METRIC RANK
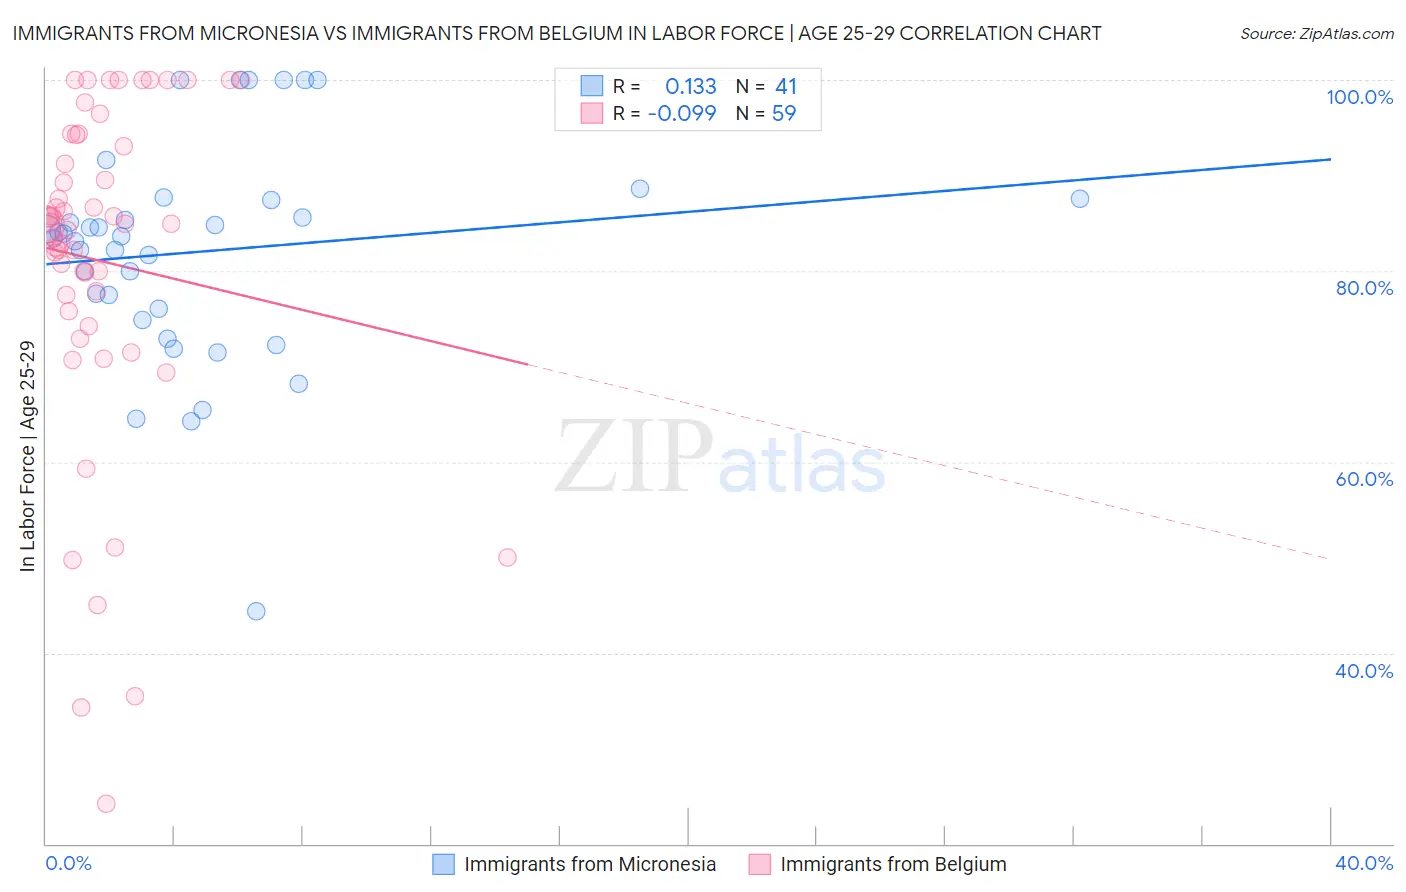
Immigrants from Micronesia vs Immigrants from Belgium In Labor Force | Age 25-29 Correlation Chart
The statistical analysis conducted on geographies consisting of 61,602,386 people shows a poor positive correlation between the proportion of Immigrants from Micronesia and labor force participation rate among population between the ages 25 and 29 in the United States with a correlation coefficient (R) of 0.133 and weighted average of 83.0%. Similarly, the statistical analysis conducted on geographies consisting of 146,686,004 people shows a slight negative correlation between the proportion of Immigrants from Belgium and labor force participation rate among population between the ages 25 and 29 in the United States with a correlation coefficient (R) of -0.099 and weighted average of 84.6%, a difference of 1.9%.
In Labor Force | Age 25-29 Correlation Summary
| Measurement | Immigrants from Micronesia | Immigrants from Belgium |
| Minimum | 44.3% | 24.2% |
| Maximum | 100.0% | 100.0% |
| Range | 55.7% | 75.8% |
| Mean | 82.0% | 81.0% |
| Median | 83.7% | 85.0% |
| Interquartile 25% (IQ1) | 75.4% | 75.8% |
| Interquartile 75% (IQ3) | 87.4% | 94.2% |
| Interquartile Range (IQR) | 12.0% | 18.4% |
| Standard Deviation (Sample) | 11.5% | 17.6% |
| Standard Deviation (Population) | 11.4% | 17.5% |
Similar Demographics by In Labor Force | Age 25-29
Demographics Similar to Immigrants from Micronesia by In Labor Force | Age 25-29
In terms of in labor force | age 25-29, the demographic groups most similar to Immigrants from Micronesia are Ottawa (83.0%, a difference of 0.020%), Immigrants from Bangladesh (83.0%, a difference of 0.030%), Hawaiian (83.0%, a difference of 0.030%), Guyanese (83.0%, a difference of 0.050%), and Immigrants from Guyana (83.0%, a difference of 0.050%).
| Demographics | Rating | Rank | In Labor Force | Age 25-29 |
| Americans | 0.0 /100 | #282 | Tragic 83.1% |
| Immigrants | Azores | 0.0 /100 | #283 | Tragic 83.1% |
| Nicaraguans | 0.0 /100 | #284 | Tragic 83.1% |
| Belizeans | 0.0 /100 | #285 | Tragic 83.1% |
| Mexican American Indians | 0.0 /100 | #286 | Tragic 83.0% |
| Guyanese | 0.0 /100 | #287 | Tragic 83.0% |
| Ottawa | 0.0 /100 | #288 | Tragic 83.0% |
| Immigrants | Micronesia | 0.0 /100 | #289 | Tragic 83.0% |
| Immigrants | Bangladesh | 0.0 /100 | #290 | Tragic 83.0% |
| Hawaiians | 0.0 /100 | #291 | Tragic 83.0% |
| Immigrants | Guyana | 0.0 /100 | #292 | Tragic 83.0% |
| Immigrants | Latin America | 0.0 /100 | #293 | Tragic 82.9% |
| Nepalese | 0.0 /100 | #294 | Tragic 82.9% |
| Chippewa | 0.0 /100 | #295 | Tragic 82.9% |
| Immigrants | Nicaragua | 0.0 /100 | #296 | Tragic 82.9% |
Demographics Similar to Immigrants from Belgium by In Labor Force | Age 25-29
In terms of in labor force | age 25-29, the demographic groups most similar to Immigrants from Belgium are Immigrants from Portugal (84.6%, a difference of 0.0%), Immigrants from Ukraine (84.5%, a difference of 0.010%), Immigrants from Denmark (84.6%, a difference of 0.020%), Moroccan (84.5%, a difference of 0.020%), and Immigrants from Kuwait (84.6%, a difference of 0.030%).
| Demographics | Rating | Rank | In Labor Force | Age 25-29 |
| Immigrants | Argentina | 44.0 /100 | #179 | Average 84.6% |
| Immigrants | South America | 42.9 /100 | #180 | Average 84.6% |
| Immigrants | Norway | 41.9 /100 | #181 | Average 84.6% |
| Europeans | 40.3 /100 | #182 | Average 84.6% |
| Scottish | 40.1 /100 | #183 | Average 84.6% |
| Immigrants | Kuwait | 38.2 /100 | #184 | Fair 84.6% |
| Immigrants | Denmark | 37.0 /100 | #185 | Fair 84.6% |
| Immigrants | Belgium | 35.0 /100 | #186 | Fair 84.6% |
| Immigrants | Portugal | 34.7 /100 | #187 | Fair 84.6% |
| Immigrants | Ukraine | 33.7 /100 | #188 | Fair 84.5% |
| Moroccans | 32.6 /100 | #189 | Fair 84.5% |
| Welsh | 31.1 /100 | #190 | Fair 84.5% |
| Zimbabweans | 28.7 /100 | #191 | Fair 84.5% |
| English | 25.8 /100 | #192 | Fair 84.5% |
| South American Indians | 25.0 /100 | #193 | Fair 84.5% |