Immigrants from Micronesia vs Immigrants from Laos In Labor Force | Age 25-29

COMPARE

Immigrants from Micronesia
Race
Ancestry
AfghanAfricanAlaska NativeAlaskan AthabascanAlbanianAleutAlsatianAmericanApacheArabArapahoArgentineanArmenianAssyrian/Chaldean/SyriacAustralianAustrianBahamianBangladeshiBarbadianBasqueBelgianBelizeanBermudanBhutaneseBlackfeetBolivianBrazilianBritishBritish West IndianBulgarianBurmeseCajunCambodianCanadianCape VerdeanCarpatho RusynCelticCentral AmericanCentral American IndianCherokeeCheyenneChickasawChileanChineseChippewaChoctawColombianColvilleComancheCosta RicanCreeCreekCroatianCrowCubanCypriotCzechCzechoslovakianDanishDelawareDominicanDutchDutch West IndianEastern EuropeanEcuadorianEgyptianEnglishEstonianEthiopianEuropeanFijianFilipinoFinnishFrenchFrench American IndianFrench CanadianGermanGerman RussianGhanaianGreekGuamanian/ChamorroGuatemalanGuyaneseHaitianHmongHonduranHopiHoumaHungarianIcelanderIndian (Asian)IndonesianInupiatIranianIraqiIrishIroquoisIsraeliItalianJamaicanJapaneseJordanianKenyanKiowaKoreanLaotianLatvianLebaneseLiberianLithuanianLumbeeLuxembourgerMacedonianMalaysianMalteseMarshalleseMenomineeMexicanMexican American IndianMongolianMoroccanNative HawaiianNavajoNepaleseNew ZealanderNicaraguanNigerianNorthern EuropeanNorwegianOkinawanOsageOttawaPaiutePakistaniPalestinianPanamanianParaguayanPennsylvania GermanPeruvianPimaPolishPortuguesePotawatomiPuebloPuerto RicanPuget Sound SalishRomanianRussianSalvadoranSamoanScandinavianScotch-IrishScottishSeminoleSenegaleseSerbianShoshoneSierra LeoneanSiouxSlavicSlovakSloveneSomaliSouth AfricanSouth AmericanSouth American IndianSoviet UnionSpaniardSpanishSpanish AmericanSpanish American IndianSri LankanSubsaharan AfricanSudaneseSwedishSwissSyrianTaiwaneseThaiTlingit-HaidaTohono O'OdhamTonganTrinidadian and TobagonianTsimshianTurkishU.S. Virgin IslanderUgandanUkrainianUruguayanUteVenezuelanVietnameseWelshWest IndianYakamaYaquiYugoslavianYumanYup'ikZimbabwean
Immigration
NonimmigrantsImmigrantsAfghanistanAfricaAlbaniaArgentinaArmeniaAsiaAustraliaAustriaBahamasBangladeshBarbadosBelarusBelgiumBelizeBoliviaBosnia and HerzegovinaBrazilBulgariaBurma/MyanmarCabo VerdeCambodiaCameroonCanadaCaribbeanCentral AmericaChileChinaColombiaCongoCosta RicaCroatiaCubaCzechoslovakiaDenmarkDominicaDominican RepublicEastern AfricaEastern AsiaEastern EuropeEcuadorEgyptEl SalvadorEnglandEritreaEthiopiaEuropeFijiFranceGermanyGhanaGreeceGrenadaGuatemalaGuyanaHaitiHondurasHong KongHungaryIndiaIndonesiaIranIraqIrelandIsraelItalyJamaicaJapanJordanKazakhstanKenyaKoreaKuwaitLatin AmericaLatviaLebanonLiberiaLithuaniaMalaysiaMexicoMicronesiaMiddle AfricaMoldovaMoroccoNepalNetherlandsNicaraguaNigeriaNorth AmericaNorth MacedoniaNorthern AfricaNorthern EuropeNorwayOceaniaPakistanPanamaPeruPhilippinesPolandPortugalRomaniaRussiaSaudi ArabiaScotlandSenegalSerbiaSierra LeoneSingaporeSomaliaSouth AfricaSouth AmericaSouth Central AsiaSouth Eastern AsiaSouthern EuropeSpainSri LankaSt. Vincent and the GrenadinesSudanSwedenSwitzerlandSyriaTaiwanThailandTrinidad and TobagoTurkeyUgandaUkraineUruguayUzbekistanVenezuelaVietnamWest IndiesWestern AfricaWestern AsiaWestern EuropeYemenZaireZimbabweAzores
Immigrants from Laos
Race
Ancestry
AfghanAfricanAlaska NativeAlaskan AthabascanAlbanianAleutAlsatianAmericanApacheArabArapahoArgentineanArmenianAssyrian/Chaldean/SyriacAustralianAustrianBahamianBangladeshiBarbadianBasqueBelgianBelizeanBermudanBhutaneseBlackfeetBolivianBrazilianBritishBritish West IndianBulgarianBurmeseCajunCambodianCanadianCape VerdeanCarpatho RusynCelticCentral AmericanCentral American IndianCherokeeCheyenneChickasawChileanChineseChippewaChoctawColombianColvilleComancheCosta RicanCreeCreekCroatianCrowCubanCypriotCzechCzechoslovakianDanishDelawareDominicanDutchDutch West IndianEastern EuropeanEcuadorianEgyptianEnglishEstonianEthiopianEuropeanFijianFilipinoFinnishFrenchFrench American IndianFrench CanadianGermanGerman RussianGhanaianGreekGuamanian/ChamorroGuatemalanGuyaneseHaitianHmongHonduranHopiHoumaHungarianIcelanderIndian (Asian)IndonesianInupiatIranianIraqiIrishIroquoisIsraeliItalianJamaicanJapaneseJordanianKenyanKiowaKoreanLaotianLatvianLebaneseLiberianLithuanianLumbeeLuxembourgerMacedonianMalaysianMalteseMarshalleseMenomineeMexicanMexican American IndianMongolianMoroccanNative HawaiianNavajoNepaleseNew ZealanderNicaraguanNigerianNorthern EuropeanNorwegianOkinawanOsageOttawaPaiutePakistaniPalestinianPanamanianParaguayanPennsylvania GermanPeruvianPimaPolishPortuguesePotawatomiPuebloPuerto RicanPuget Sound SalishRomanianRussianSalvadoranSamoanScandinavianScotch-IrishScottishSeminoleSenegaleseSerbianShoshoneSierra LeoneanSiouxSlavicSlovakSloveneSomaliSouth AfricanSouth AmericanSouth American IndianSoviet UnionSpaniardSpanishSpanish AmericanSpanish American IndianSri LankanSubsaharan AfricanSudaneseSwedishSwissSyrianTaiwaneseThaiTlingit-HaidaTohono O'OdhamTonganTrinidadian and TobagonianTsimshianTurkishU.S. Virgin IslanderUgandanUkrainianUruguayanUteVenezuelanVietnameseWelshWest IndianYakamaYaquiYugoslavianYumanYup'ikZimbabwean
Immigration
NonimmigrantsImmigrantsAfghanistanAfricaAlbaniaArgentinaArmeniaAsiaAustraliaAustriaBahamasBangladeshBarbadosBelarusBelgiumBelizeBoliviaBosnia and HerzegovinaBrazilBulgariaBurma/MyanmarCabo VerdeCambodiaCameroonCanadaCaribbeanCentral AmericaChileChinaColombiaCongoCosta RicaCroatiaCubaCzechoslovakiaDenmarkDominicaDominican RepublicEastern AfricaEastern AsiaEastern EuropeEcuadorEgyptEl SalvadorEnglandEritreaEthiopiaEuropeFijiFranceGermanyGhanaGreeceGrenadaGuatemalaGuyanaHaitiHondurasHong KongHungaryIndiaIndonesiaIranIraqIrelandIsraelItalyJamaicaJapanJordanKazakhstanKenyaKoreaKuwaitLaosLatin AmericaLatviaLebanonLiberiaLithuaniaMalaysiaMexicoMiddle AfricaMoldovaMoroccoNepalNetherlandsNicaraguaNigeriaNorth AmericaNorth MacedoniaNorthern AfricaNorthern EuropeNorwayOceaniaPakistanPanamaPeruPhilippinesPolandPortugalRomaniaRussiaSaudi ArabiaScotlandSenegalSerbiaSierra LeoneSingaporeSomaliaSouth AfricaSouth AmericaSouth Central AsiaSouth Eastern AsiaSouthern EuropeSpainSri LankaSt. Vincent and the GrenadinesSudanSwedenSwitzerlandSyriaTaiwanThailandTrinidad and TobagoTurkeyUgandaUkraineUruguayUzbekistanVenezuelaVietnamWest IndiesWestern AfricaWestern AsiaWestern EuropeYemenZaireZimbabweAzores
In Labor Force | Age 25-29
Income
Poverty
Unemployment
Labor Participation
Family Structure
Vehicle Availability
Education Level
Disability

In Labor Force | Age 25-29 Comparison

Immigrants from Micronesia

Immigrants from Laos

Tragic
Good
83.0%
IN LABOR FORCE | AGE 25-29
0.0/ 100
METRIC RATING
289th/ 347
METRIC RANK
84.8%
IN LABOR FORCE | AGE 25-29
69.0/ 100
METRIC RATING
144th/ 347
METRIC RANK

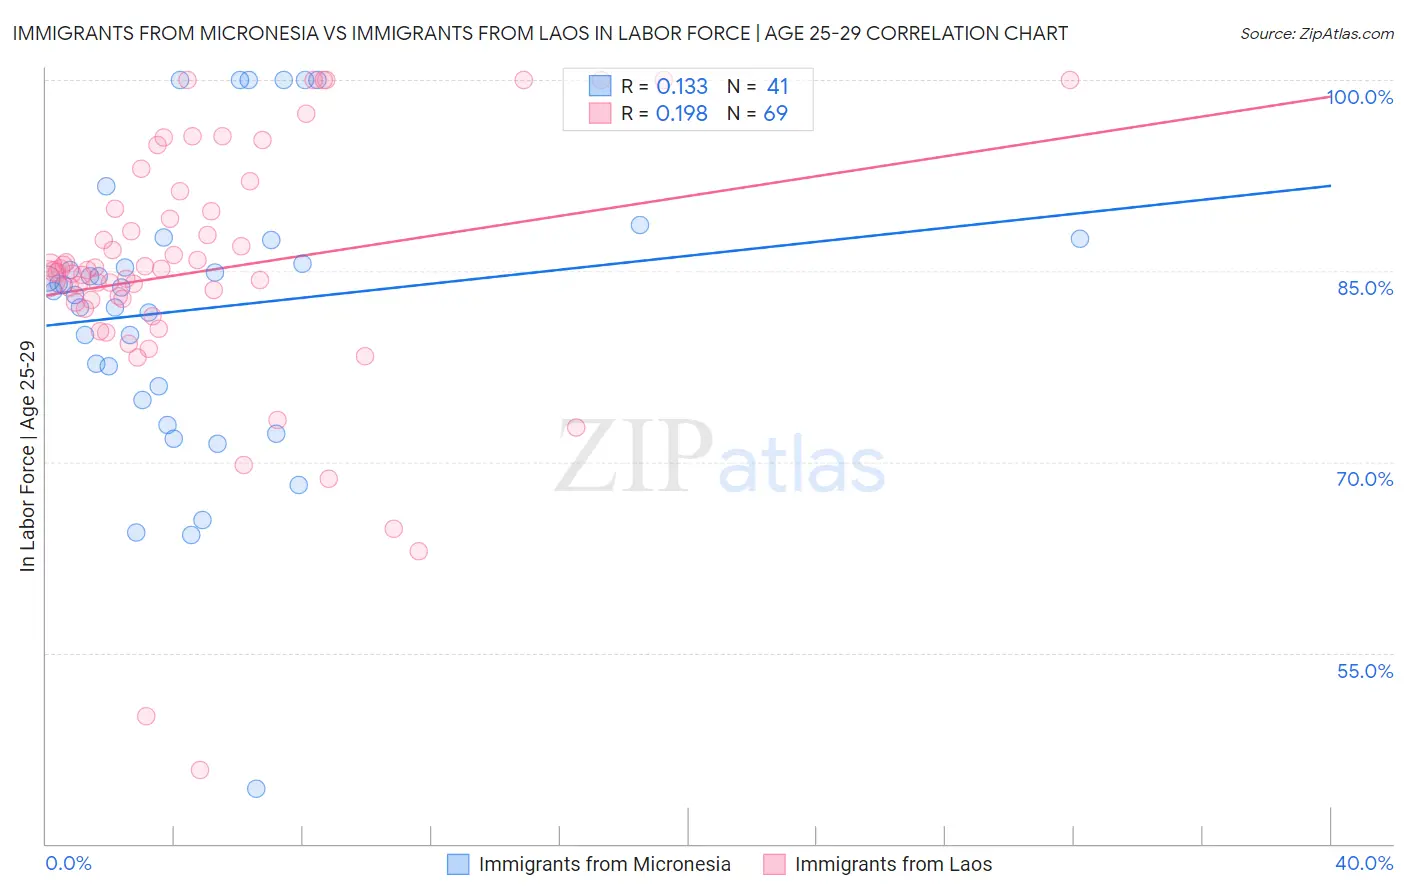
Immigrants from Micronesia vs Immigrants from Laos In Labor Force | Age 25-29 Correlation Chart

The statistical analysis conducted on geographies consisting of 61,602,386 people shows a poor positive correlation between the proportion of Immigrants from Micronesia and labor force participation rate among population between the ages 25 and 29 in the United States with a correlation coefficient (R) of 0.133 and weighted average of 83.0%. Similarly, the statistical analysis conducted on geographies consisting of 201,457,700 people shows a poor positive correlation between the proportion of Immigrants from Laos and labor force participation rate among population between the ages 25 and 29 in the United States with a correlation coefficient (R) of 0.198 and weighted average of 84.8%, a difference of 2.1%.
Immigrants from Micronesia vs Immigrants from Laos In Labor Force | Age 25-29

In Labor Force | Age 25-29 Correlation Summary

MeasurementImmigrants from MicronesiaImmigrants from Laos
Minimum44.3%45.8%
Maximum100.0%100.0%
Range55.7%54.2%
Mean82.0%85.0%
Median83.7%85.1%
Interquartile 25% (IQ1)75.4%82.3%
Interquartile 75% (IQ3)87.4%90.6%
Interquartile Range (IQR)12.0%8.3%
Standard Deviation (Sample)11.5%10.5%
Standard Deviation (Population)11.4%10.4%

Similar Demographics by In Labor Force | Age 25-29

Demographics Similar to Immigrants from Micronesia by In Labor Force | Age 25-29

In terms of in labor force | age 25-29, the demographic groups most similar to Immigrants from Micronesia are Ottawa (83.0%, a difference of 0.020%), Immigrants from Bangladesh (83.0%, a difference of 0.030%), Hawaiian (83.0%, a difference of 0.030%), Guyanese (83.0%, a difference of 0.050%), and Immigrants from Guyana (83.0%, a difference of 0.050%).
DemographicsRating | RankIn Labor Force | Age 25-29
Americans
0.0
/100
|
#282
Tragic
83.1%
Immigrants | Azores
0.0
/100
|
#283
Tragic
83.1%
Nicaraguans
0.0
/100
|
#284
Tragic
83.1%
Belizeans
0.0
/100
|
#285
Tragic
83.1%
Mexican American Indians
0.0
/100
|
#286
Tragic
83.0%
Guyanese
0.0
/100
|
#287
Tragic
83.0%
Ottawa
0.0
/100
|
#288
Tragic
83.0%
Immigrants | Micronesia
0.0
/100
|
#289
Tragic
83.0%
Immigrants | Bangladesh
0.0
/100
|
#290
Tragic
83.0%
Hawaiians
0.0
/100
|
#291
Tragic
83.0%
Immigrants | Guyana
0.0
/100
|
#292
Tragic
83.0%
Immigrants | Latin America
0.0
/100
|
#293
Tragic
82.9%
Nepalese
0.0
/100
|
#294
Tragic
82.9%
Chippewa
0.0
/100
|
#295
Tragic
82.9%
Immigrants | Nicaragua
0.0
/100
|
#296
Tragic
82.9%

Demographics Similar to Immigrants from Laos by In Labor Force | Age 25-29

In terms of in labor force | age 25-29, the demographic groups most similar to Immigrants from Laos are Sri Lankan (84.8%, a difference of 0.0%), Pakistani (84.8%, a difference of 0.010%), Immigrants from Senegal (84.8%, a difference of 0.010%), Icelander (84.8%, a difference of 0.010%), and Immigrants from Asia (84.8%, a difference of 0.010%).
DemographicsRating | RankIn Labor Force | Age 25-29
Immigrants | Canada
73.5
/100
|
#137
Good
84.8%
Armenians
72.7
/100
|
#138
Good
84.8%
Immigrants | Eastern Asia
72.6
/100
|
#139
Good
84.8%
Immigrants | North America
72.1
/100
|
#140
Good
84.8%
Danes
71.9
/100
|
#141
Good
84.8%
Pakistanis
70.0
/100
|
#142
Good
84.8%
Sri Lankans
69.2
/100
|
#143
Good
84.8%
Immigrants | Laos
69.0
/100
|
#144
Good
84.8%
Immigrants | Senegal
68.3
/100
|
#145
Good
84.8%
Icelanders
68.2
/100
|
#146
Good
84.8%
Immigrants | Asia
68.2
/100
|
#147
Good
84.8%
Immigrants | England
65.2
/100
|
#148
Good
84.7%
Peruvians
64.7
/100
|
#149
Good
84.7%
Swiss
64.7
/100
|
#150
Good
84.7%
Colombians
62.8
/100
|
#151
Good
84.7%