Immigrants from Malaysia vs Tongan Professional Degree
COMPARE
Immigrants from Malaysia
Tongan
Professional Degree
Professional Degree Comparison
Immigrants from Malaysia
Tongans
5.7%
PROFESSIONAL DEGREE
100.0/ 100
METRIC RATING
56th/ 347
METRIC RANK
3.7%
PROFESSIONAL DEGREE
1.3/ 100
METRIC RATING
254th/ 347
METRIC RANK
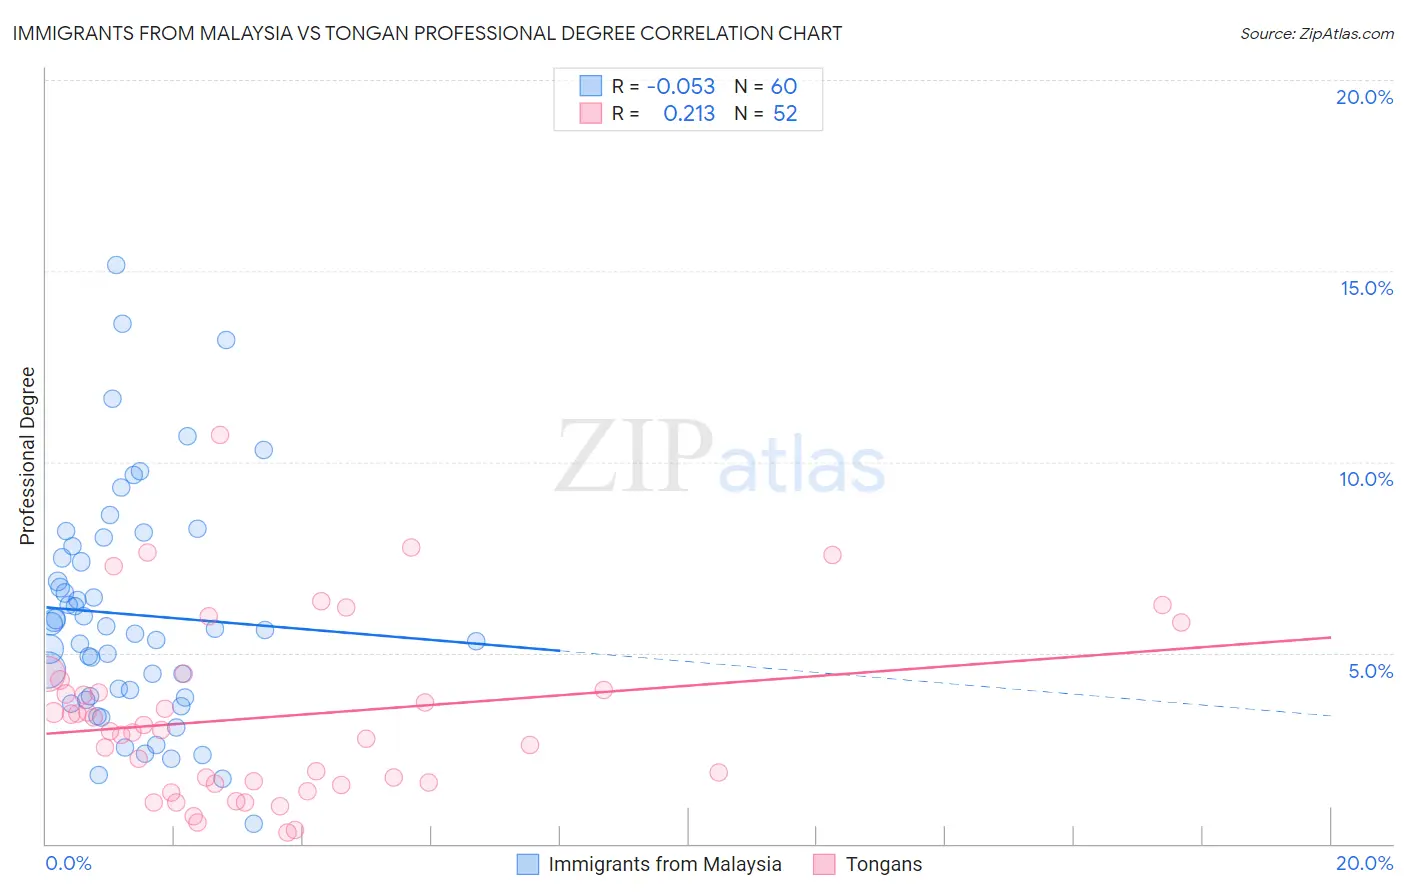
Immigrants from Malaysia vs Tongan Professional Degree Correlation Chart
The statistical analysis conducted on geographies consisting of 197,901,227 people shows a slight negative correlation between the proportion of Immigrants from Malaysia and percentage of population with at least professional degree education in the United States with a correlation coefficient (R) of -0.053 and weighted average of 5.7%. Similarly, the statistical analysis conducted on geographies consisting of 102,718,733 people shows a weak positive correlation between the proportion of Tongans and percentage of population with at least professional degree education in the United States with a correlation coefficient (R) of 0.213 and weighted average of 3.7%, a difference of 53.8%.
Professional Degree Correlation Summary
| Measurement | Immigrants from Malaysia | Tongan |
| Minimum | 0.51% | 0.30% |
| Maximum | 15.2% | 10.7% |
| Range | 14.6% | 10.4% |
| Mean | 6.0% | 3.3% |
| Median | 5.6% | 3.0% |
| Interquartile 25% (IQ1) | 3.8% | 1.6% |
| Interquartile 75% (IQ3) | 7.6% | 4.2% |
| Interquartile Range (IQR) | 3.8% | 2.6% |
| Standard Deviation (Sample) | 3.0% | 2.3% |
| Standard Deviation (Population) | 3.0% | 2.2% |
Similar Demographics by Professional Degree
Demographics Similar to Immigrants from Malaysia by Professional Degree
In terms of professional degree, the demographic groups most similar to Immigrants from Malaysia are Immigrants from Western Europe (5.7%, a difference of 0.12%), South African (5.7%, a difference of 0.26%), Immigrants from Kuwait (5.7%, a difference of 0.52%), Bulgarian (5.7%, a difference of 0.86%), and Immigrants from Europe (5.6%, a difference of 1.4%).
| Demographics | Rating | Rank | Professional Degree |
| Immigrants | Latvia | 100.0 /100 | #49 | Exceptional 5.8% |
| Immigrants | Czechoslovakia | 100.0 /100 | #50 | Exceptional 5.8% |
| Immigrants | Greece | 100.0 /100 | #51 | Exceptional 5.8% |
| Immigrants | Serbia | 100.0 /100 | #52 | Exceptional 5.8% |
| Immigrants | Netherlands | 100.0 /100 | #53 | Exceptional 5.8% |
| Immigrants | Kuwait | 100.0 /100 | #54 | Exceptional 5.7% |
| Immigrants | Western Europe | 100.0 /100 | #55 | Exceptional 5.7% |
| Immigrants | Malaysia | 100.0 /100 | #56 | Exceptional 5.7% |
| South Africans | 100.0 /100 | #57 | Exceptional 5.7% |
| Bulgarians | 100.0 /100 | #58 | Exceptional 5.7% |
| Immigrants | Europe | 100.0 /100 | #59 | Exceptional 5.6% |
| Bolivians | 99.9 /100 | #60 | Exceptional 5.6% |
| Immigrants | Lithuania | 99.9 /100 | #61 | Exceptional 5.6% |
| Immigrants | Belarus | 99.9 /100 | #62 | Exceptional 5.5% |
| Asians | 99.9 /100 | #63 | Exceptional 5.5% |
Demographics Similar to Tongans by Professional Degree
In terms of professional degree, the demographic groups most similar to Tongans are Pueblo (3.7%, a difference of 0.14%), Jamaican (3.7%, a difference of 0.24%), Immigrants from Nicaragua (3.7%, a difference of 0.39%), Osage (3.7%, a difference of 0.43%), and Iroquois (3.7%, a difference of 0.53%).
| Demographics | Rating | Rank | Professional Degree |
| Guyanese | 1.6 /100 | #247 | Tragic 3.8% |
| Hmong | 1.6 /100 | #248 | Tragic 3.7% |
| Immigrants | Grenada | 1.5 /100 | #249 | Tragic 3.7% |
| Immigrants | Fiji | 1.5 /100 | #250 | Tragic 3.7% |
| Immigrants | Nicaragua | 1.4 /100 | #251 | Tragic 3.7% |
| Jamaicans | 1.4 /100 | #252 | Tragic 3.7% |
| Pueblo | 1.4 /100 | #253 | Tragic 3.7% |
| Tongans | 1.3 /100 | #254 | Tragic 3.7% |
| Osage | 1.2 /100 | #255 | Tragic 3.7% |
| Iroquois | 1.2 /100 | #256 | Tragic 3.7% |
| Bahamians | 1.1 /100 | #257 | Tragic 3.7% |
| Immigrants | St. Vincent and the Grenadines | 1.1 /100 | #258 | Tragic 3.7% |
| Africans | 1.0 /100 | #259 | Tragic 3.7% |
| Indonesians | 1.0 /100 | #260 | Tragic 3.7% |
| Immigrants | Guyana | 1.0 /100 | #261 | Tragic 3.7% |