Immigrants from Malaysia vs Immigrants from Eastern Europe In Labor Force | Age > 16
COMPARE
Immigrants from Malaysia
Immigrants from Eastern Europe
In Labor Force | Age > 16
In Labor Force | Age > 16 Comparison
Immigrants from Malaysia
Immigrants from Eastern Europe
66.1%
IN LABOR FORCE | AGE > 16
99.6/ 100
METRIC RATING
76th/ 347
METRIC RANK
65.4%
IN LABOR FORCE | AGE > 16
78.3/ 100
METRIC RATING
154th/ 347
METRIC RANK
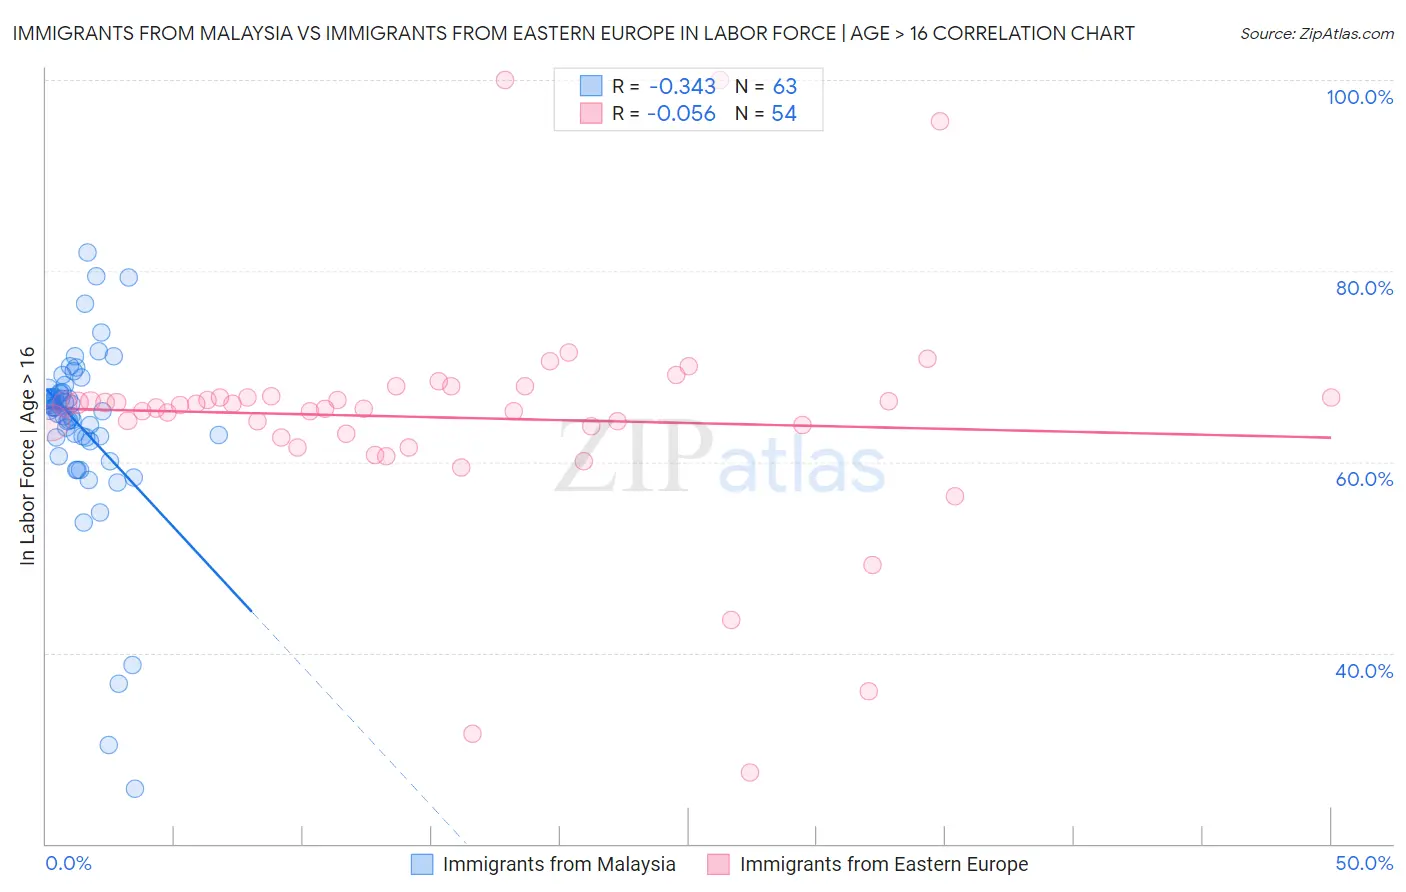
Immigrants from Malaysia vs Immigrants from Eastern Europe In Labor Force | Age > 16 Correlation Chart
The statistical analysis conducted on geographies consisting of 197,973,684 people shows a mild negative correlation between the proportion of Immigrants from Malaysia and labor force participation rate among population ages 16 and over in the United States with a correlation coefficient (R) of -0.343 and weighted average of 66.1%. Similarly, the statistical analysis conducted on geographies consisting of 475,885,468 people shows a slight negative correlation between the proportion of Immigrants from Eastern Europe and labor force participation rate among population ages 16 and over in the United States with a correlation coefficient (R) of -0.056 and weighted average of 65.4%, a difference of 1.2%.
In Labor Force | Age > 16 Correlation Summary
| Measurement | Immigrants from Malaysia | Immigrants from Eastern Europe |
| Minimum | 25.8% | 27.4% |
| Maximum | 81.9% | 100.0% |
| Range | 56.1% | 72.6% |
| Mean | 63.7% | 64.6% |
| Median | 65.7% | 65.8% |
| Interquartile 25% (IQ1) | 62.5% | 62.9% |
| Interquartile 75% (IQ3) | 67.3% | 66.7% |
| Interquartile Range (IQR) | 4.8% | 3.8% |
| Standard Deviation (Sample) | 9.7% | 12.2% |
| Standard Deviation (Population) | 9.6% | 12.1% |
Similar Demographics by In Labor Force | Age > 16
Demographics Similar to Immigrants from Malaysia by In Labor Force | Age > 16
In terms of in labor force | age > 16, the demographic groups most similar to Immigrants from Malaysia are Immigrants from Moldova (66.1%, a difference of 0.010%), Immigrants from Asia (66.1%, a difference of 0.010%), Turkish (66.1%, a difference of 0.040%), Immigrants from Singapore (66.2%, a difference of 0.050%), and Malaysian (66.1%, a difference of 0.050%).
| Demographics | Rating | Rank | In Labor Force | Age > 16 |
| Sub-Saharan Africans | 99.7 /100 | #69 | Exceptional 66.2% |
| Asians | 99.7 /100 | #70 | Exceptional 66.2% |
| Burmese | 99.7 /100 | #71 | Exceptional 66.2% |
| Taiwanese | 99.7 /100 | #72 | Exceptional 66.2% |
| Immigrants | Vietnam | 99.7 /100 | #73 | Exceptional 66.2% |
| Immigrants | Korea | 99.7 /100 | #74 | Exceptional 66.2% |
| Immigrants | Singapore | 99.7 /100 | #75 | Exceptional 66.2% |
| Immigrants | Malaysia | 99.6 /100 | #76 | Exceptional 66.1% |
| Immigrants | Moldova | 99.6 /100 | #77 | Exceptional 66.1% |
| Immigrants | Asia | 99.6 /100 | #78 | Exceptional 66.1% |
| Turks | 99.6 /100 | #79 | Exceptional 66.1% |
| Malaysians | 99.6 /100 | #80 | Exceptional 66.1% |
| Moroccans | 99.5 /100 | #81 | Exceptional 66.1% |
| German Russians | 99.4 /100 | #82 | Exceptional 66.1% |
| Immigrants | Jordan | 99.4 /100 | #83 | Exceptional 66.1% |
Demographics Similar to Immigrants from Eastern Europe by In Labor Force | Age > 16
In terms of in labor force | age > 16, the demographic groups most similar to Immigrants from Eastern Europe are Immigrants from Armenia (65.3%, a difference of 0.030%), Immigrants from China (65.4%, a difference of 0.040%), Immigrants from Ireland (65.3%, a difference of 0.040%), Immigrants from Russia (65.3%, a difference of 0.040%), and Yugoslavian (65.4%, a difference of 0.050%).
| Demographics | Rating | Rank | In Labor Force | Age > 16 |
| Immigrants | Oceania | 87.5 /100 | #147 | Excellent 65.5% |
| Bhutanese | 86.3 /100 | #148 | Excellent 65.5% |
| Immigrants | Albania | 85.7 /100 | #149 | Excellent 65.4% |
| Immigrants | Immigrants | 81.9 /100 | #150 | Excellent 65.4% |
| Czechs | 81.5 /100 | #151 | Excellent 65.4% |
| Yugoslavians | 81.3 /100 | #152 | Excellent 65.4% |
| Immigrants | China | 80.5 /100 | #153 | Excellent 65.4% |
| Immigrants | Eastern Europe | 78.3 /100 | #154 | Good 65.4% |
| Immigrants | Armenia | 76.6 /100 | #155 | Good 65.3% |
| Immigrants | Ireland | 75.9 /100 | #156 | Good 65.3% |
| Immigrants | Russia | 75.7 /100 | #157 | Good 65.3% |
| Panamanians | 75.2 /100 | #158 | Good 65.3% |
| Immigrants | Syria | 74.6 /100 | #159 | Good 65.3% |
| Immigrants | South Africa | 73.5 /100 | #160 | Good 65.3% |
| Australians | 71.3 /100 | #161 | Good 65.3% |