Bolivian vs Immigrants from Central America In Labor Force | Age 20-24
COMPARE
Bolivian
Immigrants from Central America
In Labor Force | Age 20-24
In Labor Force | Age 20-24 Comparison
Bolivians
Immigrants from Central America
75.2%
IN LABOR FORCE | AGE 20-24
64.0/ 100
METRIC RATING
164th/ 347
METRIC RANK
75.0%
IN LABOR FORCE | AGE 20-24
45.0/ 100
METRIC RATING
178th/ 347
METRIC RANK
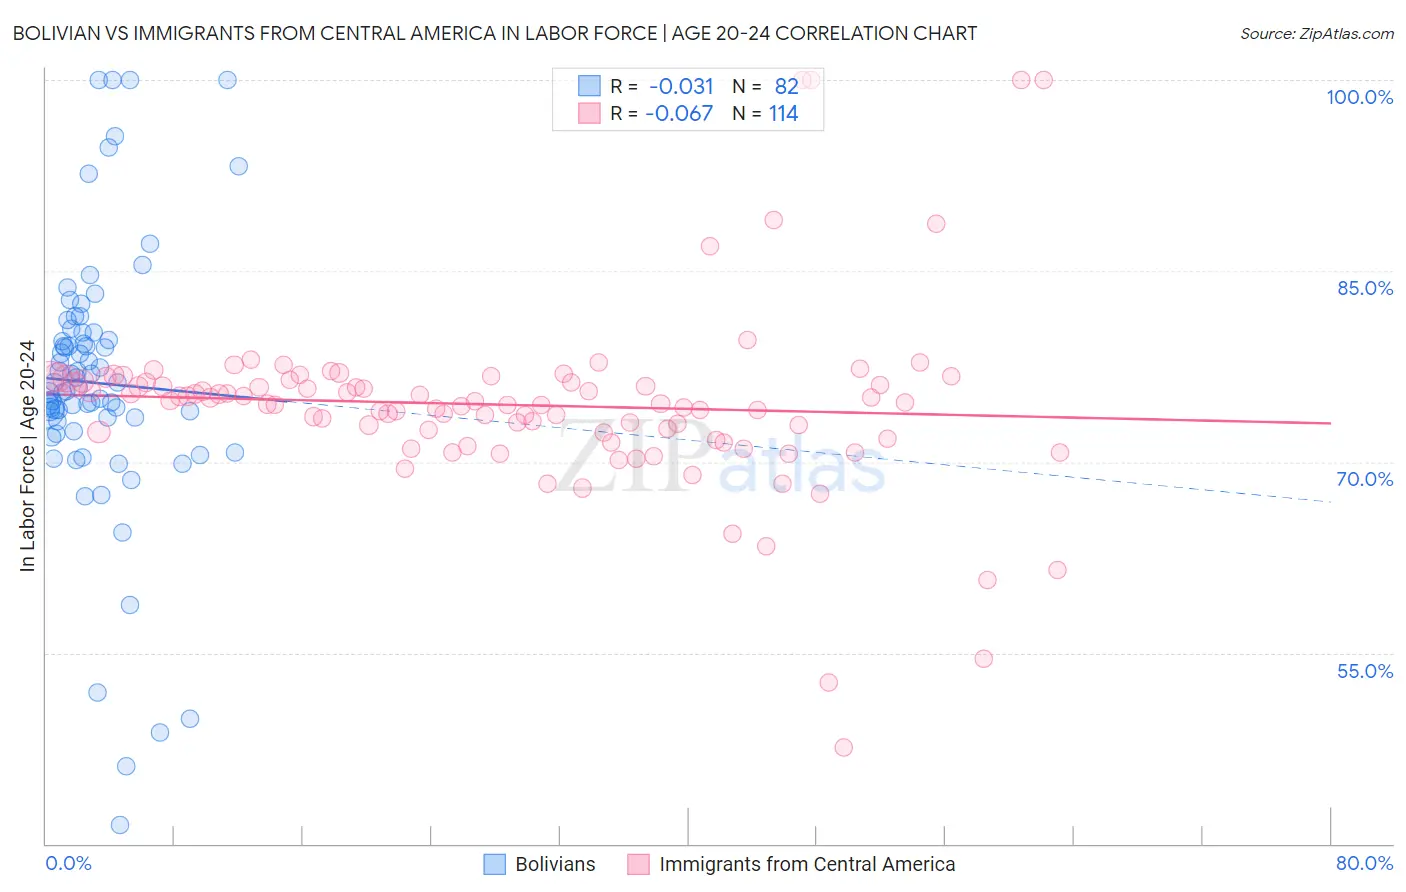
Bolivian vs Immigrants from Central America In Labor Force | Age 20-24 Correlation Chart
The statistical analysis conducted on geographies consisting of 184,640,260 people shows no correlation between the proportion of Bolivians and labor force participation rate among population between the ages 20 and 24 in the United States with a correlation coefficient (R) of -0.031 and weighted average of 75.2%. Similarly, the statistical analysis conducted on geographies consisting of 535,780,199 people shows a slight negative correlation between the proportion of Immigrants from Central America and labor force participation rate among population between the ages 20 and 24 in the United States with a correlation coefficient (R) of -0.067 and weighted average of 75.0%, a difference of 0.28%.
In Labor Force | Age 20-24 Correlation Summary
| Measurement | Bolivian | Immigrants from Central America |
| Minimum | 41.5% | 47.5% |
| Maximum | 100.0% | 100.0% |
| Range | 58.5% | 52.5% |
| Mean | 76.2% | 74.5% |
| Median | 76.0% | 74.6% |
| Interquartile 25% (IQ1) | 73.2% | 72.4% |
| Interquartile 75% (IQ3) | 80.2% | 76.3% |
| Interquartile Range (IQR) | 6.9% | 4.0% |
| Standard Deviation (Sample) | 10.8% | 7.3% |
| Standard Deviation (Population) | 10.7% | 7.3% |
Demographics Similar to Bolivians and Immigrants from Central America by In Labor Force | Age 20-24
In terms of in labor force | age 20-24, the demographic groups most similar to Bolivians are Costa Rican (75.2%, a difference of 0.0%), Immigrants from Romania (75.2%, a difference of 0.010%), Afghan (75.2%, a difference of 0.010%), New Zealander (75.2%, a difference of 0.020%), and Cambodian (75.2%, a difference of 0.050%). Similarly, the demographic groups most similar to Immigrants from Central America are Immigrants from Latvia (75.0%, a difference of 0.010%), Immigrants from Czechoslovakia (75.0%, a difference of 0.010%), Immigrants from Mexico (75.0%, a difference of 0.040%), African (75.0%, a difference of 0.040%), and Central American (75.0%, a difference of 0.050%).
| Demographics | Rating | Rank | In Labor Force | Age 20-24 |
| New Zealanders | 65.4 /100 | #161 | Good 75.2% |
| Immigrants | Romania | 64.6 /100 | #162 | Good 75.2% |
| Costa Ricans | 64.2 /100 | #163 | Good 75.2% |
| Bolivians | 64.0 /100 | #164 | Good 75.2% |
| Afghans | 63.5 /100 | #165 | Good 75.2% |
| Cambodians | 60.5 /100 | #166 | Good 75.2% |
| Immigrants | South Eastern Asia | 57.5 /100 | #167 | Average 75.1% |
| Immigrants | Western Africa | 56.7 /100 | #168 | Average 75.1% |
| Immigrants | Philippines | 55.8 /100 | #169 | Average 75.1% |
| Mexicans | 52.1 /100 | #170 | Average 75.1% |
| Cajuns | 51.1 /100 | #171 | Average 75.1% |
| Yakama | 50.8 /100 | #172 | Average 75.1% |
| Immigrants | Croatia | 50.2 /100 | #173 | Average 75.1% |
| South Africans | 50.0 /100 | #174 | Average 75.0% |
| Syrians | 49.5 /100 | #175 | Average 75.0% |
| Central Americans | 48.7 /100 | #176 | Average 75.0% |
| Immigrants | Mexico | 47.8 /100 | #177 | Average 75.0% |
| Immigrants | Central America | 45.0 /100 | #178 | Average 75.0% |
| Immigrants | Latvia | 44.1 /100 | #179 | Average 75.0% |
| Immigrants | Czechoslovakia | 44.0 /100 | #180 | Average 75.0% |
| Africans | 42.5 /100 | #181 | Average 75.0% |