Maltese vs Immigrants from Central America In Labor Force | Age 20-24
COMPARE
Maltese
Immigrants from Central America
In Labor Force | Age 20-24
In Labor Force | Age 20-24 Comparison
Maltese
Immigrants from Central America
76.3%
IN LABOR FORCE | AGE 20-24
98.9/ 100
METRIC RATING
92nd/ 347
METRIC RANK
75.0%
IN LABOR FORCE | AGE 20-24
45.0/ 100
METRIC RATING
178th/ 347
METRIC RANK
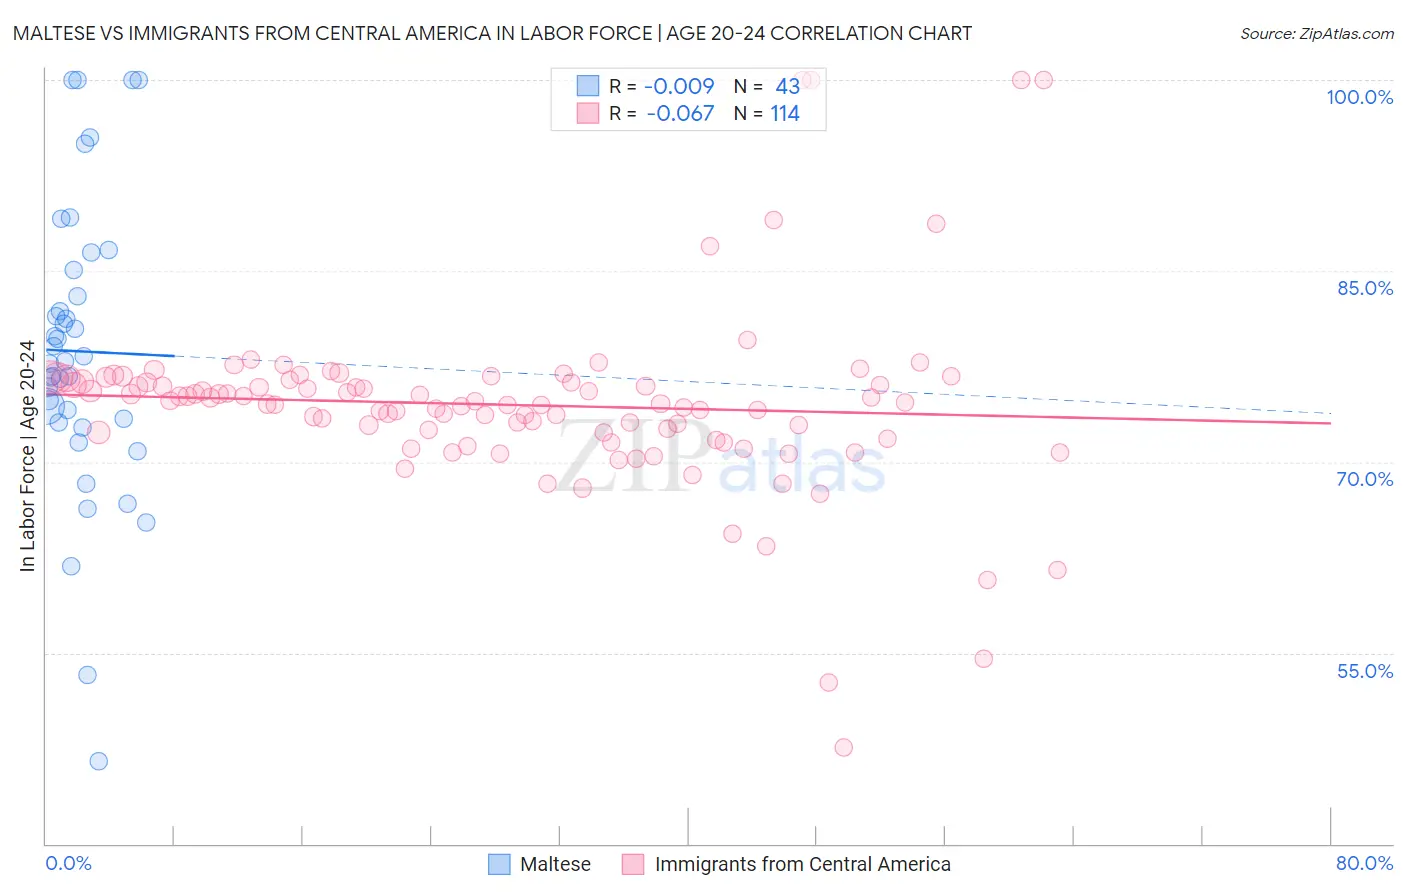
Maltese vs Immigrants from Central America In Labor Force | Age 20-24 Correlation Chart
The statistical analysis conducted on geographies consisting of 126,433,922 people shows no correlation between the proportion of Maltese and labor force participation rate among population between the ages 20 and 24 in the United States with a correlation coefficient (R) of -0.009 and weighted average of 76.3%. Similarly, the statistical analysis conducted on geographies consisting of 535,780,199 people shows a slight negative correlation between the proportion of Immigrants from Central America and labor force participation rate among population between the ages 20 and 24 in the United States with a correlation coefficient (R) of -0.067 and weighted average of 75.0%, a difference of 1.7%.
In Labor Force | Age 20-24 Correlation Summary
| Measurement | Maltese | Immigrants from Central America |
| Minimum | 46.5% | 47.5% |
| Maximum | 100.0% | 100.0% |
| Range | 53.5% | 52.5% |
| Mean | 78.7% | 74.5% |
| Median | 77.9% | 74.6% |
| Interquartile 25% (IQ1) | 73.1% | 72.4% |
| Interquartile 75% (IQ3) | 85.1% | 76.3% |
| Interquartile Range (IQR) | 12.0% | 4.0% |
| Standard Deviation (Sample) | 11.6% | 7.3% |
| Standard Deviation (Population) | 11.5% | 7.3% |
Similar Demographics by In Labor Force | Age 20-24
Demographics Similar to Maltese by In Labor Force | Age 20-24
In terms of in labor force | age 20-24, the demographic groups most similar to Maltese are Hungarian (76.3%, a difference of 0.020%), Sierra Leonean (76.3%, a difference of 0.030%), Immigrants from Burma/Myanmar (76.3%, a difference of 0.050%), Spanish (76.4%, a difference of 0.10%), and Bulgarian (76.4%, a difference of 0.10%).
| Demographics | Rating | Rank | In Labor Force | Age 20-24 |
| Portuguese | 99.3 /100 | #85 | Exceptional 76.4% |
| Immigrants | Iraq | 99.3 /100 | #86 | Exceptional 76.4% |
| Immigrants | Thailand | 99.3 /100 | #87 | Exceptional 76.4% |
| Spanish | 99.2 /100 | #88 | Exceptional 76.4% |
| Bulgarians | 99.2 /100 | #89 | Exceptional 76.4% |
| Immigrants | Burma/Myanmar | 99.1 /100 | #90 | Exceptional 76.3% |
| Sierra Leoneans | 99.0 /100 | #91 | Exceptional 76.3% |
| Maltese | 98.9 /100 | #92 | Exceptional 76.3% |
| Hungarians | 98.9 /100 | #93 | Exceptional 76.3% |
| Potawatomi | 98.5 /100 | #94 | Exceptional 76.2% |
| Immigrants | Germany | 98.5 /100 | #95 | Exceptional 76.2% |
| Immigrants | Nonimmigrants | 98.5 /100 | #96 | Exceptional 76.2% |
| Immigrants | Lithuania | 98.0 /100 | #97 | Exceptional 76.1% |
| Immigrants | Oceania | 98.0 /100 | #98 | Exceptional 76.1% |
| Americans | 97.8 /100 | #99 | Exceptional 76.1% |
Demographics Similar to Immigrants from Central America by In Labor Force | Age 20-24
In terms of in labor force | age 20-24, the demographic groups most similar to Immigrants from Central America are Immigrants from Latvia (75.0%, a difference of 0.010%), Immigrants from Czechoslovakia (75.0%, a difference of 0.010%), Immigrants from Mexico (75.0%, a difference of 0.040%), African (75.0%, a difference of 0.040%), and Central American (75.0%, a difference of 0.050%).
| Demographics | Rating | Rank | In Labor Force | Age 20-24 |
| Cajuns | 51.1 /100 | #171 | Average 75.1% |
| Yakama | 50.8 /100 | #172 | Average 75.1% |
| Immigrants | Croatia | 50.2 /100 | #173 | Average 75.1% |
| South Africans | 50.0 /100 | #174 | Average 75.0% |
| Syrians | 49.5 /100 | #175 | Average 75.0% |
| Central Americans | 48.7 /100 | #176 | Average 75.0% |
| Immigrants | Mexico | 47.8 /100 | #177 | Average 75.0% |
| Immigrants | Central America | 45.0 /100 | #178 | Average 75.0% |
| Immigrants | Latvia | 44.1 /100 | #179 | Average 75.0% |
| Immigrants | Czechoslovakia | 44.0 /100 | #180 | Average 75.0% |
| Africans | 42.5 /100 | #181 | Average 75.0% |
| Immigrants | South Africa | 36.9 /100 | #182 | Fair 74.9% |
| Immigrants | Costa Rica | 36.7 /100 | #183 | Fair 74.9% |
| Immigrants | Hungary | 35.0 /100 | #184 | Fair 74.9% |
| Sri Lankans | 34.9 /100 | #185 | Fair 74.9% |