Immigrants from Kuwait vs Yaqui In Labor Force | Age 45-54
COMPARE
Immigrants from Kuwait
Yaqui
In Labor Force | Age 45-54
In Labor Force | Age 45-54 Comparison
Immigrants from Kuwait
Yaqui
83.3%
IN LABOR FORCE | AGE 45-54
94.8/ 100
METRIC RATING
96th/ 347
METRIC RANK
78.9%
IN LABOR FORCE | AGE 45-54
0.0/ 100
METRIC RATING
320th/ 347
METRIC RANK
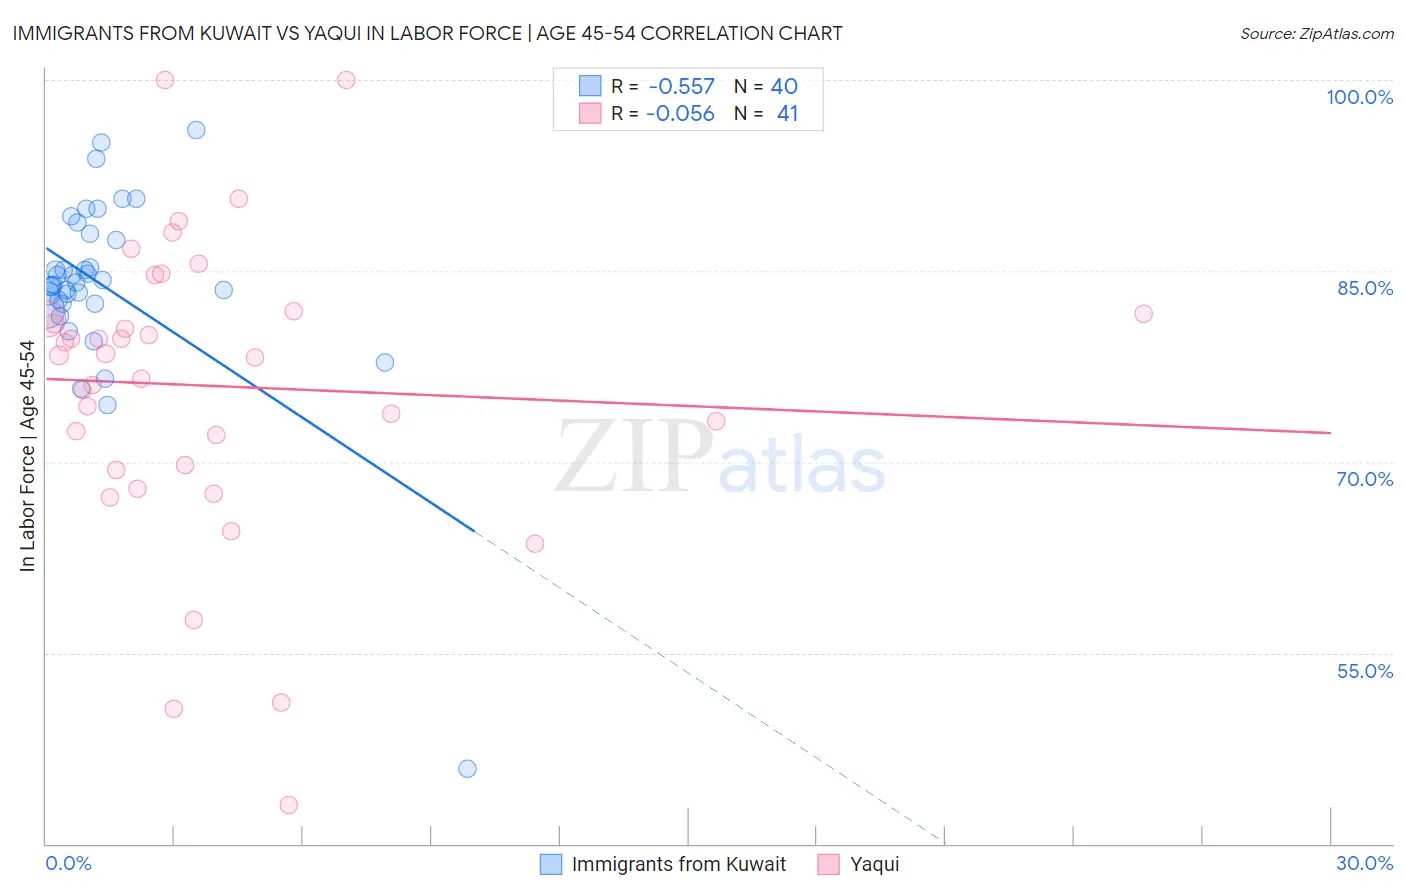
Immigrants from Kuwait vs Yaqui In Labor Force | Age 45-54 Correlation Chart
The statistical analysis conducted on geographies consisting of 136,878,759 people shows a substantial negative correlation between the proportion of Immigrants from Kuwait and labor force participation rate among population between the ages 45 and 54 in the United States with a correlation coefficient (R) of -0.557 and weighted average of 83.3%. Similarly, the statistical analysis conducted on geographies consisting of 107,713,051 people shows a slight negative correlation between the proportion of Yaqui and labor force participation rate among population between the ages 45 and 54 in the United States with a correlation coefficient (R) of -0.056 and weighted average of 78.9%, a difference of 5.6%.
In Labor Force | Age 45-54 Correlation Summary
| Measurement | Immigrants from Kuwait | Yaqui |
| Minimum | 45.9% | 43.0% |
| Maximum | 96.1% | 100.0% |
| Range | 50.2% | 57.0% |
| Mean | 83.8% | 76.0% |
| Median | 84.0% | 78.4% |
| Interquartile 25% (IQ1) | 82.4% | 69.6% |
| Interquartile 75% (IQ3) | 87.7% | 81.7% |
| Interquartile Range (IQR) | 5.3% | 12.1% |
| Standard Deviation (Sample) | 7.8% | 11.8% |
| Standard Deviation (Population) | 7.7% | 11.7% |
Similar Demographics by In Labor Force | Age 45-54
Demographics Similar to Immigrants from Kuwait by In Labor Force | Age 45-54
In terms of in labor force | age 45-54, the demographic groups most similar to Immigrants from Kuwait are Immigrants from Argentina (83.3%, a difference of 0.0%), Palestinian (83.3%, a difference of 0.0%), Argentinean (83.3%, a difference of 0.010%), Danish (83.3%, a difference of 0.020%), and Italian (83.3%, a difference of 0.020%).
| Demographics | Rating | Rank | In Labor Force | Age 45-54 |
| Indians (Asian) | 95.5 /100 | #89 | Exceptional 83.3% |
| Immigrants | Japan | 95.5 /100 | #90 | Exceptional 83.3% |
| South Americans | 95.5 /100 | #91 | Exceptional 83.3% |
| Danes | 95.3 /100 | #92 | Exceptional 83.3% |
| Italians | 95.1 /100 | #93 | Exceptional 83.3% |
| Argentineans | 94.9 /100 | #94 | Exceptional 83.3% |
| Immigrants | Argentina | 94.9 /100 | #95 | Exceptional 83.3% |
| Immigrants | Kuwait | 94.8 /100 | #96 | Exceptional 83.3% |
| Palestinians | 94.8 /100 | #97 | Exceptional 83.3% |
| Maltese | 94.4 /100 | #98 | Exceptional 83.3% |
| Immigrants | Middle Africa | 94.3 /100 | #99 | Exceptional 83.3% |
| Mongolians | 94.2 /100 | #100 | Exceptional 83.3% |
| Immigrants | Belarus | 94.1 /100 | #101 | Exceptional 83.3% |
| Immigrants | Singapore | 93.9 /100 | #102 | Exceptional 83.3% |
| Albanians | 93.9 /100 | #103 | Exceptional 83.3% |
Demographics Similar to Yaqui by In Labor Force | Age 45-54
In terms of in labor force | age 45-54, the demographic groups most similar to Yaqui are Cherokee (79.0%, a difference of 0.10%), Chickasaw (79.0%, a difference of 0.21%), Yup'ik (78.6%, a difference of 0.30%), Comanche (79.2%, a difference of 0.38%), and Shoshone (79.3%, a difference of 0.52%).
| Demographics | Rating | Rank | In Labor Force | Age 45-54 |
| Colville | 0.0 /100 | #313 | Tragic 79.5% |
| Ottawa | 0.0 /100 | #314 | Tragic 79.5% |
| Blacks/African Americans | 0.0 /100 | #315 | Tragic 79.3% |
| Shoshone | 0.0 /100 | #316 | Tragic 79.3% |
| Comanche | 0.0 /100 | #317 | Tragic 79.2% |
| Chickasaw | 0.0 /100 | #318 | Tragic 79.0% |
| Cherokee | 0.0 /100 | #319 | Tragic 79.0% |
| Yaqui | 0.0 /100 | #320 | Tragic 78.9% |
| Yup'ik | 0.0 /100 | #321 | Tragic 78.6% |
| Crow | 0.0 /100 | #322 | Tragic 78.3% |
| Kiowa | 0.0 /100 | #323 | Tragic 78.3% |
| Dutch West Indians | 0.0 /100 | #324 | Tragic 78.2% |
| Choctaw | 0.0 /100 | #325 | Tragic 78.2% |
| Seminole | 0.0 /100 | #326 | Tragic 78.1% |
| Cajuns | 0.0 /100 | #327 | Tragic 78.1% |