Immigrants from Kuwait vs Immigrants from Japan In Labor Force | Age 45-54
COMPARE
Immigrants from Kuwait
Immigrants from Japan
In Labor Force | Age 45-54
In Labor Force | Age 45-54 Comparison
Immigrants from Kuwait
Immigrants from Japan
83.3%
IN LABOR FORCE | AGE 45-54
94.8/ 100
METRIC RATING
96th/ 347
METRIC RANK
83.3%
IN LABOR FORCE | AGE 45-54
95.5/ 100
METRIC RATING
90th/ 347
METRIC RANK
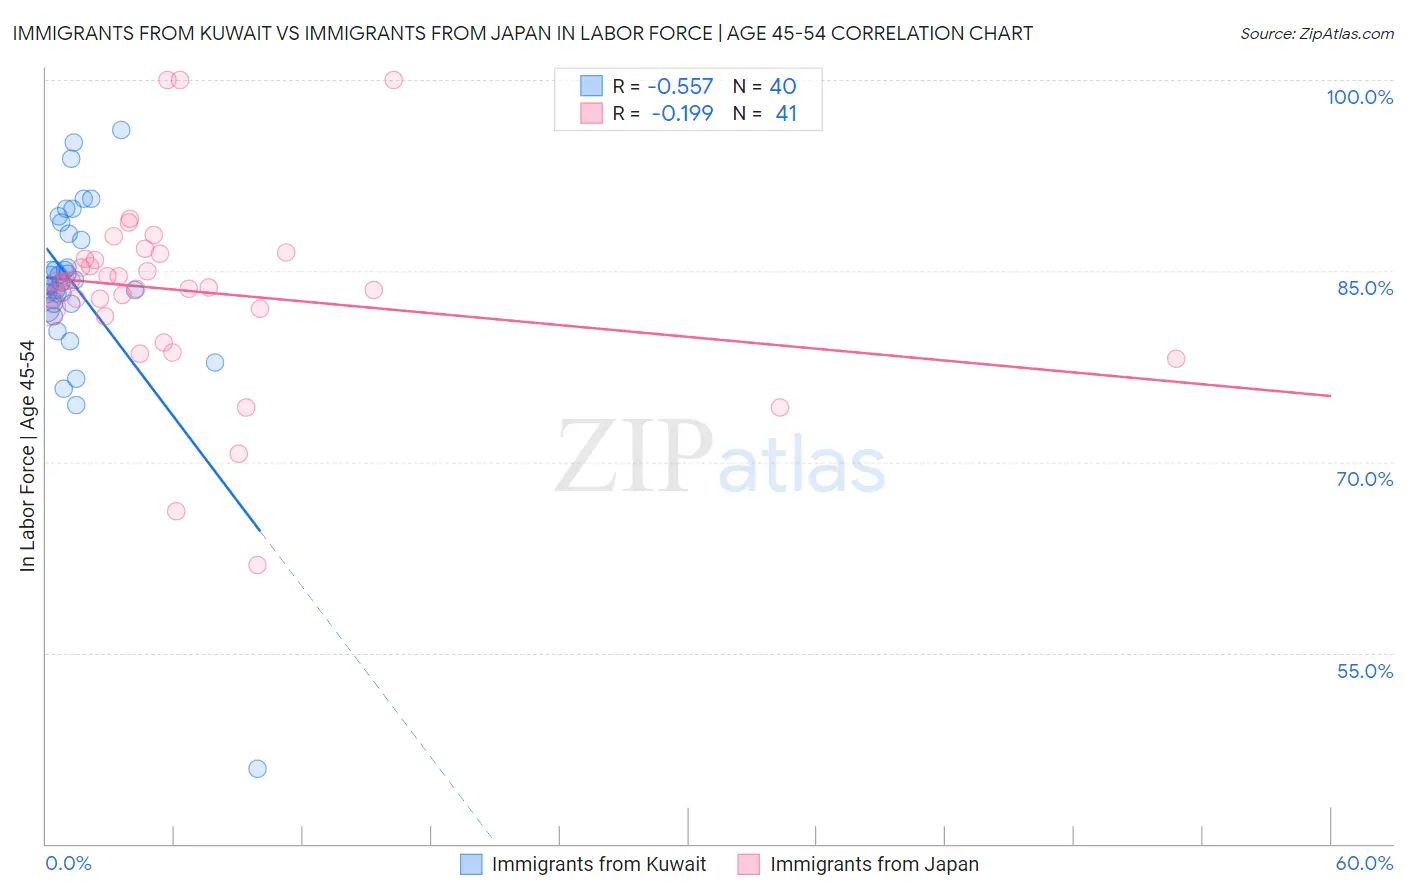
Immigrants from Kuwait vs Immigrants from Japan In Labor Force | Age 45-54 Correlation Chart
The statistical analysis conducted on geographies consisting of 136,878,759 people shows a substantial negative correlation between the proportion of Immigrants from Kuwait and labor force participation rate among population between the ages 45 and 54 in the United States with a correlation coefficient (R) of -0.557 and weighted average of 83.3%. Similarly, the statistical analysis conducted on geographies consisting of 339,969,041 people shows a poor negative correlation between the proportion of Immigrants from Japan and labor force participation rate among population between the ages 45 and 54 in the United States with a correlation coefficient (R) of -0.199 and weighted average of 83.3%, a difference of 0.030%.
In Labor Force | Age 45-54 Correlation Summary
| Measurement | Immigrants from Kuwait | Immigrants from Japan |
| Minimum | 45.9% | 61.9% |
| Maximum | 96.1% | 100.0% |
| Range | 50.2% | 38.1% |
| Mean | 83.8% | 83.4% |
| Median | 84.0% | 84.1% |
| Interquartile 25% (IQ1) | 82.4% | 81.7% |
| Interquartile 75% (IQ3) | 87.7% | 86.2% |
| Interquartile Range (IQR) | 5.3% | 4.4% |
| Standard Deviation (Sample) | 7.8% | 7.4% |
| Standard Deviation (Population) | 7.7% | 7.3% |
Demographics Similar to Immigrants from Kuwait and Immigrants from Japan by In Labor Force | Age 45-54
In terms of in labor force | age 45-54, the demographic groups most similar to Immigrants from Kuwait are Immigrants from Argentina (83.3%, a difference of 0.0%), Palestinian (83.3%, a difference of 0.0%), Argentinean (83.3%, a difference of 0.010%), Danish (83.3%, a difference of 0.020%), and Italian (83.3%, a difference of 0.020%). Similarly, the demographic groups most similar to Immigrants from Japan are Immigrants from Eastern Europe (83.3%, a difference of 0.0%), Immigrants from Asia (83.3%, a difference of 0.0%), Indian (Asian) (83.3%, a difference of 0.0%), South American (83.3%, a difference of 0.0%), and Immigrants from Northern Africa (83.3%, a difference of 0.010%).
| Demographics | Rating | Rank | In Labor Force | Age 45-54 |
| Immigrants | Zimbabwe | 96.3 /100 | #83 | Exceptional 83.4% |
| Immigrants | Bosnia and Herzegovina | 96.0 /100 | #84 | Exceptional 83.3% |
| Greeks | 95.9 /100 | #85 | Exceptional 83.3% |
| Immigrants | Northern Africa | 95.7 /100 | #86 | Exceptional 83.3% |
| Immigrants | Eastern Europe | 95.6 /100 | #87 | Exceptional 83.3% |
| Immigrants | Asia | 95.6 /100 | #88 | Exceptional 83.3% |
| Indians (Asian) | 95.5 /100 | #89 | Exceptional 83.3% |
| Immigrants | Japan | 95.5 /100 | #90 | Exceptional 83.3% |
| South Americans | 95.5 /100 | #91 | Exceptional 83.3% |
| Danes | 95.3 /100 | #92 | Exceptional 83.3% |
| Italians | 95.1 /100 | #93 | Exceptional 83.3% |
| Argentineans | 94.9 /100 | #94 | Exceptional 83.3% |
| Immigrants | Argentina | 94.9 /100 | #95 | Exceptional 83.3% |
| Immigrants | Kuwait | 94.8 /100 | #96 | Exceptional 83.3% |
| Palestinians | 94.8 /100 | #97 | Exceptional 83.3% |
| Maltese | 94.4 /100 | #98 | Exceptional 83.3% |
| Immigrants | Middle Africa | 94.3 /100 | #99 | Exceptional 83.3% |
| Mongolians | 94.2 /100 | #100 | Exceptional 83.3% |
| Immigrants | Belarus | 94.1 /100 | #101 | Exceptional 83.3% |
| Immigrants | Singapore | 93.9 /100 | #102 | Exceptional 83.3% |
| Albanians | 93.9 /100 | #103 | Exceptional 83.3% |