American vs Yaqui In Labor Force | Age 45-54
COMPARE
American
Yaqui
In Labor Force | Age 45-54
In Labor Force | Age 45-54 Comparison
Americans
Yaqui
80.4%
IN LABOR FORCE | AGE 45-54
0.0/ 100
METRIC RATING
297th/ 347
METRIC RANK
78.9%
IN LABOR FORCE | AGE 45-54
0.0/ 100
METRIC RATING
320th/ 347
METRIC RANK
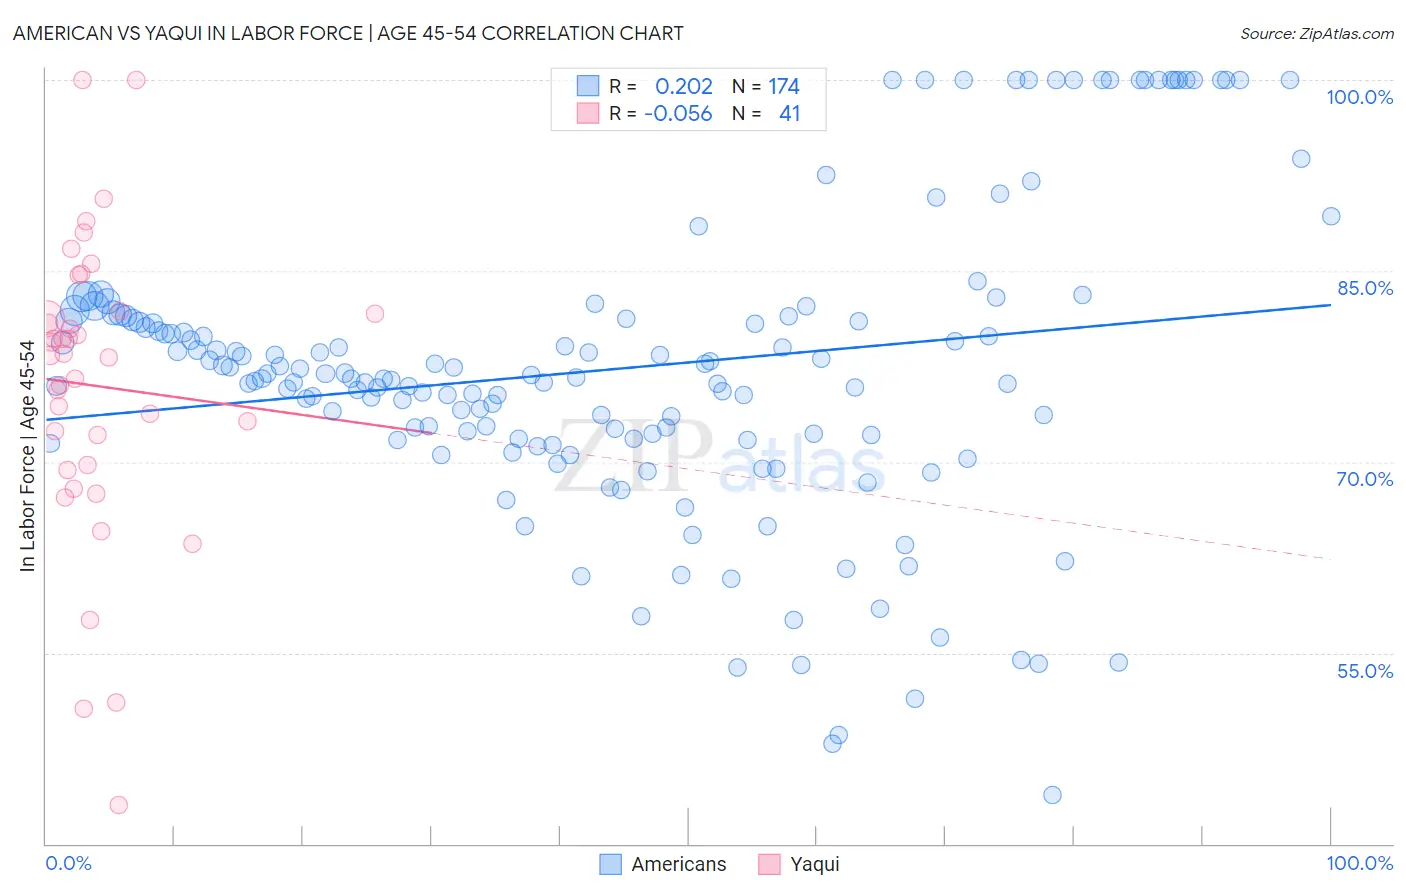
American vs Yaqui In Labor Force | Age 45-54 Correlation Chart
The statistical analysis conducted on geographies consisting of 581,101,031 people shows a weak positive correlation between the proportion of Americans and labor force participation rate among population between the ages 45 and 54 in the United States with a correlation coefficient (R) of 0.202 and weighted average of 80.4%. Similarly, the statistical analysis conducted on geographies consisting of 107,713,051 people shows a slight negative correlation between the proportion of Yaqui and labor force participation rate among population between the ages 45 and 54 in the United States with a correlation coefficient (R) of -0.056 and weighted average of 78.9%, a difference of 1.9%.
In Labor Force | Age 45-54 Correlation Summary
| Measurement | American | Yaqui |
| Minimum | 43.8% | 43.0% |
| Maximum | 100.0% | 100.0% |
| Range | 56.2% | 57.0% |
| Mean | 77.3% | 76.0% |
| Median | 76.6% | 78.4% |
| Interquartile 25% (IQ1) | 71.8% | 69.6% |
| Interquartile 75% (IQ3) | 81.3% | 81.7% |
| Interquartile Range (IQR) | 9.5% | 12.1% |
| Standard Deviation (Sample) | 11.8% | 11.8% |
| Standard Deviation (Population) | 11.8% | 11.7% |
Similar Demographics by In Labor Force | Age 45-54
Demographics Similar to Americans by In Labor Force | Age 45-54
In terms of in labor force | age 45-54, the demographic groups most similar to Americans are Marshallese (80.3%, a difference of 0.040%), Dominican (80.3%, a difference of 0.15%), Fijian (80.2%, a difference of 0.15%), Spanish American Indian (80.2%, a difference of 0.17%), and African (80.5%, a difference of 0.18%).
| Demographics | Rating | Rank | In Labor Force | Age 45-54 |
| Mexican American Indians | 0.0 /100 | #290 | Tragic 80.7% |
| Immigrants | Belize | 0.0 /100 | #291 | Tragic 80.6% |
| Iroquois | 0.0 /100 | #292 | Tragic 80.6% |
| Osage | 0.0 /100 | #293 | Tragic 80.6% |
| Yakama | 0.0 /100 | #294 | Tragic 80.6% |
| Nepalese | 0.0 /100 | #295 | Tragic 80.5% |
| Africans | 0.0 /100 | #296 | Tragic 80.5% |
| Americans | 0.0 /100 | #297 | Tragic 80.4% |
| Marshallese | 0.0 /100 | #298 | Tragic 80.3% |
| Dominicans | 0.0 /100 | #299 | Tragic 80.3% |
| Fijians | 0.0 /100 | #300 | Tragic 80.2% |
| Spanish American Indians | 0.0 /100 | #301 | Tragic 80.2% |
| Immigrants | Central America | 0.0 /100 | #302 | Tragic 80.2% |
| Immigrants | Azores | 0.0 /100 | #303 | Tragic 80.1% |
| Hispanics or Latinos | 0.0 /100 | #304 | Tragic 80.1% |
Demographics Similar to Yaqui by In Labor Force | Age 45-54
In terms of in labor force | age 45-54, the demographic groups most similar to Yaqui are Cherokee (79.0%, a difference of 0.10%), Chickasaw (79.0%, a difference of 0.21%), Yup'ik (78.6%, a difference of 0.30%), Comanche (79.2%, a difference of 0.38%), and Shoshone (79.3%, a difference of 0.52%).
| Demographics | Rating | Rank | In Labor Force | Age 45-54 |
| Colville | 0.0 /100 | #313 | Tragic 79.5% |
| Ottawa | 0.0 /100 | #314 | Tragic 79.5% |
| Blacks/African Americans | 0.0 /100 | #315 | Tragic 79.3% |
| Shoshone | 0.0 /100 | #316 | Tragic 79.3% |
| Comanche | 0.0 /100 | #317 | Tragic 79.2% |
| Chickasaw | 0.0 /100 | #318 | Tragic 79.0% |
| Cherokee | 0.0 /100 | #319 | Tragic 79.0% |
| Yaqui | 0.0 /100 | #320 | Tragic 78.9% |
| Yup'ik | 0.0 /100 | #321 | Tragic 78.6% |
| Crow | 0.0 /100 | #322 | Tragic 78.3% |
| Kiowa | 0.0 /100 | #323 | Tragic 78.3% |
| Dutch West Indians | 0.0 /100 | #324 | Tragic 78.2% |
| Choctaw | 0.0 /100 | #325 | Tragic 78.2% |
| Seminole | 0.0 /100 | #326 | Tragic 78.1% |
| Cajuns | 0.0 /100 | #327 | Tragic 78.1% |