Immigrants from Kuwait vs Chinese In Labor Force | Age 45-54
COMPARE
Immigrants from Kuwait
Chinese
In Labor Force | Age 45-54
In Labor Force | Age 45-54 Comparison
Immigrants from Kuwait
Chinese
83.3%
IN LABOR FORCE | AGE 45-54
94.8/ 100
METRIC RATING
96th/ 347
METRIC RANK
84.1%
IN LABOR FORCE | AGE 45-54
99.9/ 100
METRIC RATING
13th/ 347
METRIC RANK
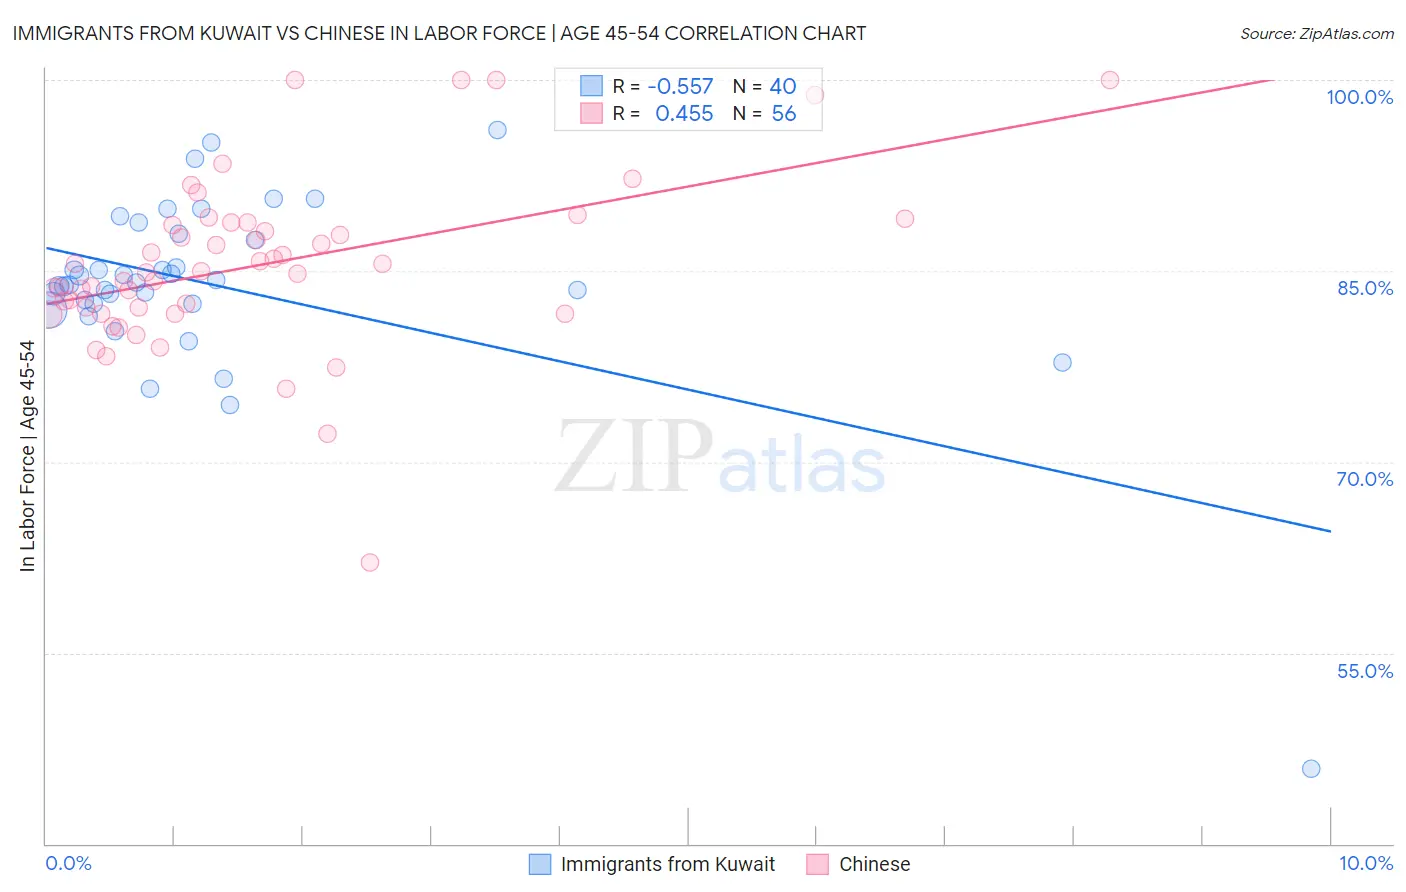
Immigrants from Kuwait vs Chinese In Labor Force | Age 45-54 Correlation Chart
The statistical analysis conducted on geographies consisting of 136,878,759 people shows a substantial negative correlation between the proportion of Immigrants from Kuwait and labor force participation rate among population between the ages 45 and 54 in the United States with a correlation coefficient (R) of -0.557 and weighted average of 83.3%. Similarly, the statistical analysis conducted on geographies consisting of 64,795,821 people shows a moderate positive correlation between the proportion of Chinese and labor force participation rate among population between the ages 45 and 54 in the United States with a correlation coefficient (R) of 0.455 and weighted average of 84.1%, a difference of 1.0%.
In Labor Force | Age 45-54 Correlation Summary
| Measurement | Immigrants from Kuwait | Chinese |
| Minimum | 45.9% | 62.1% |
| Maximum | 96.1% | 100.0% |
| Range | 50.2% | 37.9% |
| Mean | 83.8% | 85.5% |
| Median | 84.0% | 84.9% |
| Interquartile 25% (IQ1) | 82.4% | 81.9% |
| Interquartile 75% (IQ3) | 87.7% | 88.7% |
| Interquartile Range (IQR) | 5.3% | 6.8% |
| Standard Deviation (Sample) | 7.8% | 6.8% |
| Standard Deviation (Population) | 7.7% | 6.7% |
Similar Demographics by In Labor Force | Age 45-54
Demographics Similar to Immigrants from Kuwait by In Labor Force | Age 45-54
In terms of in labor force | age 45-54, the demographic groups most similar to Immigrants from Kuwait are Immigrants from Argentina (83.3%, a difference of 0.0%), Palestinian (83.3%, a difference of 0.0%), Argentinean (83.3%, a difference of 0.010%), Danish (83.3%, a difference of 0.020%), and Italian (83.3%, a difference of 0.020%).
| Demographics | Rating | Rank | In Labor Force | Age 45-54 |
| Indians (Asian) | 95.5 /100 | #89 | Exceptional 83.3% |
| Immigrants | Japan | 95.5 /100 | #90 | Exceptional 83.3% |
| South Americans | 95.5 /100 | #91 | Exceptional 83.3% |
| Danes | 95.3 /100 | #92 | Exceptional 83.3% |
| Italians | 95.1 /100 | #93 | Exceptional 83.3% |
| Argentineans | 94.9 /100 | #94 | Exceptional 83.3% |
| Immigrants | Argentina | 94.9 /100 | #95 | Exceptional 83.3% |
| Immigrants | Kuwait | 94.8 /100 | #96 | Exceptional 83.3% |
| Palestinians | 94.8 /100 | #97 | Exceptional 83.3% |
| Maltese | 94.4 /100 | #98 | Exceptional 83.3% |
| Immigrants | Middle Africa | 94.3 /100 | #99 | Exceptional 83.3% |
| Mongolians | 94.2 /100 | #100 | Exceptional 83.3% |
| Immigrants | Belarus | 94.1 /100 | #101 | Exceptional 83.3% |
| Immigrants | Singapore | 93.9 /100 | #102 | Exceptional 83.3% |
| Albanians | 93.9 /100 | #103 | Exceptional 83.3% |
Demographics Similar to Chinese by In Labor Force | Age 45-54
In terms of in labor force | age 45-54, the demographic groups most similar to Chinese are Cambodian (84.1%, a difference of 0.030%), Cypriot (84.1%, a difference of 0.090%), Bulgarian (84.2%, a difference of 0.11%), Immigrants from Nepal (84.0%, a difference of 0.11%), and Zimbabwean (84.0%, a difference of 0.13%).
| Demographics | Rating | Rank | In Labor Force | Age 45-54 |
| Immigrants | India | 100.0 /100 | #6 | Exceptional 84.7% |
| Immigrants | Cameroon | 100.0 /100 | #7 | Exceptional 84.6% |
| Sierra Leoneans | 100.0 /100 | #8 | Exceptional 84.5% |
| Immigrants | Sierra Leone | 100.0 /100 | #9 | Exceptional 84.4% |
| Norwegians | 100.0 /100 | #10 | Exceptional 84.4% |
| Thais | 100.0 /100 | #11 | Exceptional 84.3% |
| Bulgarians | 100.0 /100 | #12 | Exceptional 84.2% |
| Chinese | 99.9 /100 | #13 | Exceptional 84.1% |
| Cambodians | 99.9 /100 | #14 | Exceptional 84.1% |
| Cypriots | 99.9 /100 | #15 | Exceptional 84.1% |
| Immigrants | Nepal | 99.9 /100 | #16 | Exceptional 84.0% |
| Zimbabweans | 99.9 /100 | #17 | Exceptional 84.0% |
| Immigrants | South Central Asia | 99.9 /100 | #18 | Exceptional 84.0% |
| Czechs | 99.8 /100 | #19 | Exceptional 83.9% |
| Immigrants | Eastern Africa | 99.8 /100 | #20 | Exceptional 83.9% |