Albanian vs Yaqui In Labor Force | Age 45-54
COMPARE
Albanian
Yaqui
In Labor Force | Age 45-54
In Labor Force | Age 45-54 Comparison
Albanians
Yaqui
83.3%
IN LABOR FORCE | AGE 45-54
93.9/ 100
METRIC RATING
103rd/ 347
METRIC RANK
78.9%
IN LABOR FORCE | AGE 45-54
0.0/ 100
METRIC RATING
320th/ 347
METRIC RANK
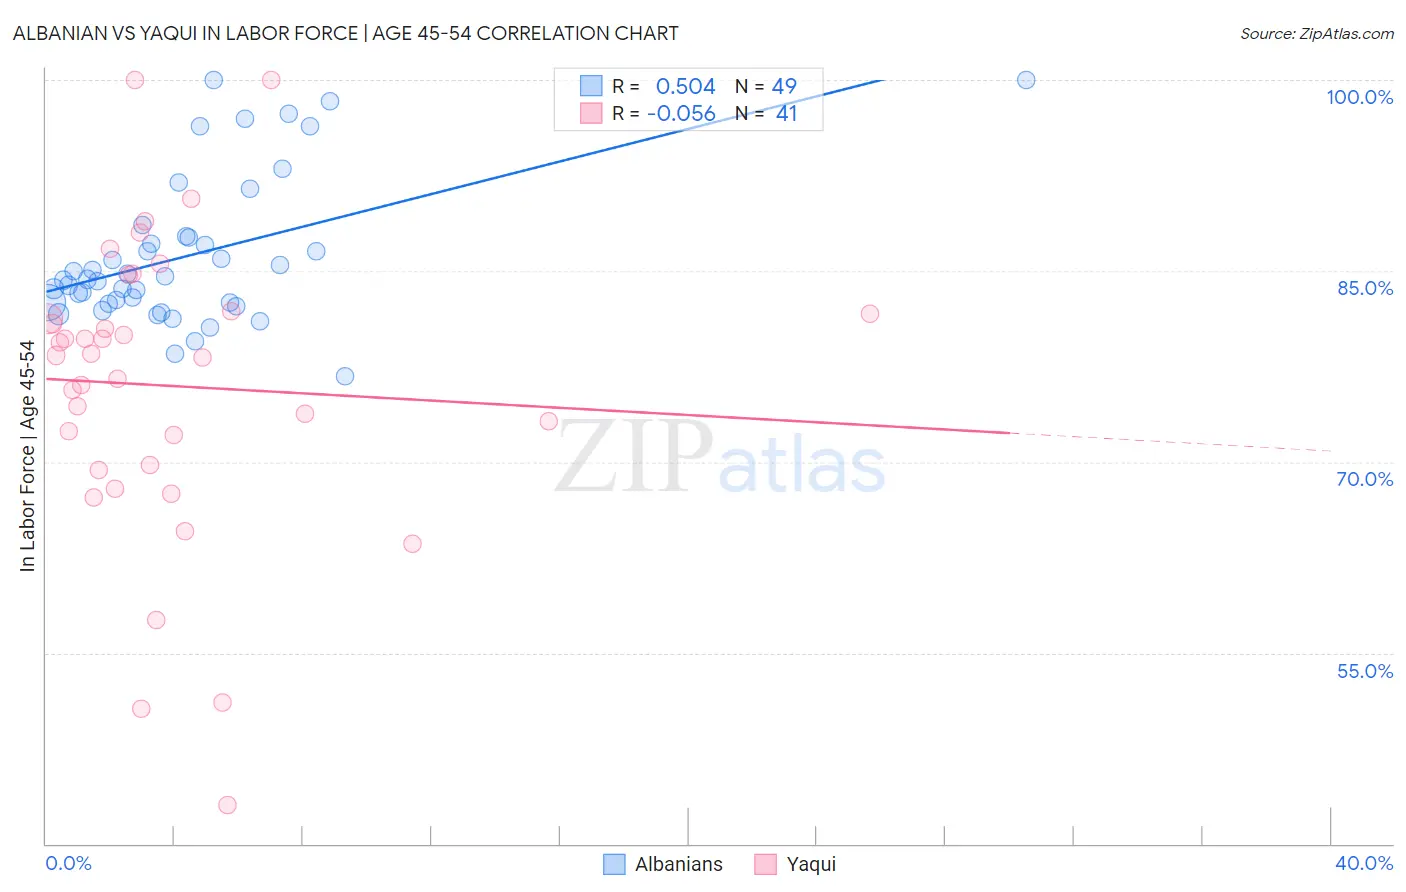
Albanian vs Yaqui In Labor Force | Age 45-54 Correlation Chart
The statistical analysis conducted on geographies consisting of 193,191,598 people shows a substantial positive correlation between the proportion of Albanians and labor force participation rate among population between the ages 45 and 54 in the United States with a correlation coefficient (R) of 0.504 and weighted average of 83.3%. Similarly, the statistical analysis conducted on geographies consisting of 107,713,051 people shows a slight negative correlation between the proportion of Yaqui and labor force participation rate among population between the ages 45 and 54 in the United States with a correlation coefficient (R) of -0.056 and weighted average of 78.9%, a difference of 5.6%.
In Labor Force | Age 45-54 Correlation Summary
| Measurement | Albanian | Yaqui |
| Minimum | 76.7% | 43.0% |
| Maximum | 100.0% | 100.0% |
| Range | 23.3% | 57.0% |
| Mean | 86.2% | 76.0% |
| Median | 84.3% | 78.4% |
| Interquartile 25% (IQ1) | 82.5% | 69.6% |
| Interquartile 75% (IQ3) | 87.7% | 81.7% |
| Interquartile Range (IQR) | 5.2% | 12.1% |
| Standard Deviation (Sample) | 5.8% | 11.8% |
| Standard Deviation (Population) | 5.7% | 11.7% |
Similar Demographics by In Labor Force | Age 45-54
Demographics Similar to Albanians by In Labor Force | Age 45-54
In terms of in labor force | age 45-54, the demographic groups most similar to Albanians are Immigrants from Singapore (83.3%, a difference of 0.0%), Immigrants from Romania (83.3%, a difference of 0.0%), Immigrants from Middle Africa (83.3%, a difference of 0.010%), Mongolian (83.3%, a difference of 0.010%), and Immigrants from Belarus (83.3%, a difference of 0.010%).
| Demographics | Rating | Rank | In Labor Force | Age 45-54 |
| Immigrants | Kuwait | 94.8 /100 | #96 | Exceptional 83.3% |
| Palestinians | 94.8 /100 | #97 | Exceptional 83.3% |
| Maltese | 94.4 /100 | #98 | Exceptional 83.3% |
| Immigrants | Middle Africa | 94.3 /100 | #99 | Exceptional 83.3% |
| Mongolians | 94.2 /100 | #100 | Exceptional 83.3% |
| Immigrants | Belarus | 94.1 /100 | #101 | Exceptional 83.3% |
| Immigrants | Singapore | 93.9 /100 | #102 | Exceptional 83.3% |
| Albanians | 93.9 /100 | #103 | Exceptional 83.3% |
| Immigrants | Romania | 93.8 /100 | #104 | Exceptional 83.3% |
| Immigrants | South America | 93.5 /100 | #105 | Exceptional 83.2% |
| Sri Lankans | 93.2 /100 | #106 | Exceptional 83.2% |
| Iranians | 92.9 /100 | #107 | Exceptional 83.2% |
| Slovaks | 92.8 /100 | #108 | Exceptional 83.2% |
| Ukrainians | 92.7 /100 | #109 | Exceptional 83.2% |
| Immigrants | Africa | 92.6 /100 | #110 | Exceptional 83.2% |
Demographics Similar to Yaqui by In Labor Force | Age 45-54
In terms of in labor force | age 45-54, the demographic groups most similar to Yaqui are Cherokee (79.0%, a difference of 0.10%), Chickasaw (79.0%, a difference of 0.21%), Yup'ik (78.6%, a difference of 0.30%), Comanche (79.2%, a difference of 0.38%), and Shoshone (79.3%, a difference of 0.52%).
| Demographics | Rating | Rank | In Labor Force | Age 45-54 |
| Colville | 0.0 /100 | #313 | Tragic 79.5% |
| Ottawa | 0.0 /100 | #314 | Tragic 79.5% |
| Blacks/African Americans | 0.0 /100 | #315 | Tragic 79.3% |
| Shoshone | 0.0 /100 | #316 | Tragic 79.3% |
| Comanche | 0.0 /100 | #317 | Tragic 79.2% |
| Chickasaw | 0.0 /100 | #318 | Tragic 79.0% |
| Cherokee | 0.0 /100 | #319 | Tragic 79.0% |
| Yaqui | 0.0 /100 | #320 | Tragic 78.9% |
| Yup'ik | 0.0 /100 | #321 | Tragic 78.6% |
| Crow | 0.0 /100 | #322 | Tragic 78.3% |
| Kiowa | 0.0 /100 | #323 | Tragic 78.3% |
| Dutch West Indians | 0.0 /100 | #324 | Tragic 78.2% |
| Choctaw | 0.0 /100 | #325 | Tragic 78.2% |
| Seminole | 0.0 /100 | #326 | Tragic 78.1% |
| Cajuns | 0.0 /100 | #327 | Tragic 78.1% |