Immigrants from Kuwait vs Immigrants from Nicaragua In Labor Force | Age 45-54
COMPARE
Immigrants from Kuwait
Immigrants from Nicaragua
In Labor Force | Age 45-54
In Labor Force | Age 45-54 Comparison
Immigrants from Kuwait
Immigrants from Nicaragua
83.3%
IN LABOR FORCE | AGE 45-54
94.8/ 100
METRIC RATING
96th/ 347
METRIC RANK
82.7%
IN LABOR FORCE | AGE 45-54
44.6/ 100
METRIC RATING
177th/ 347
METRIC RANK
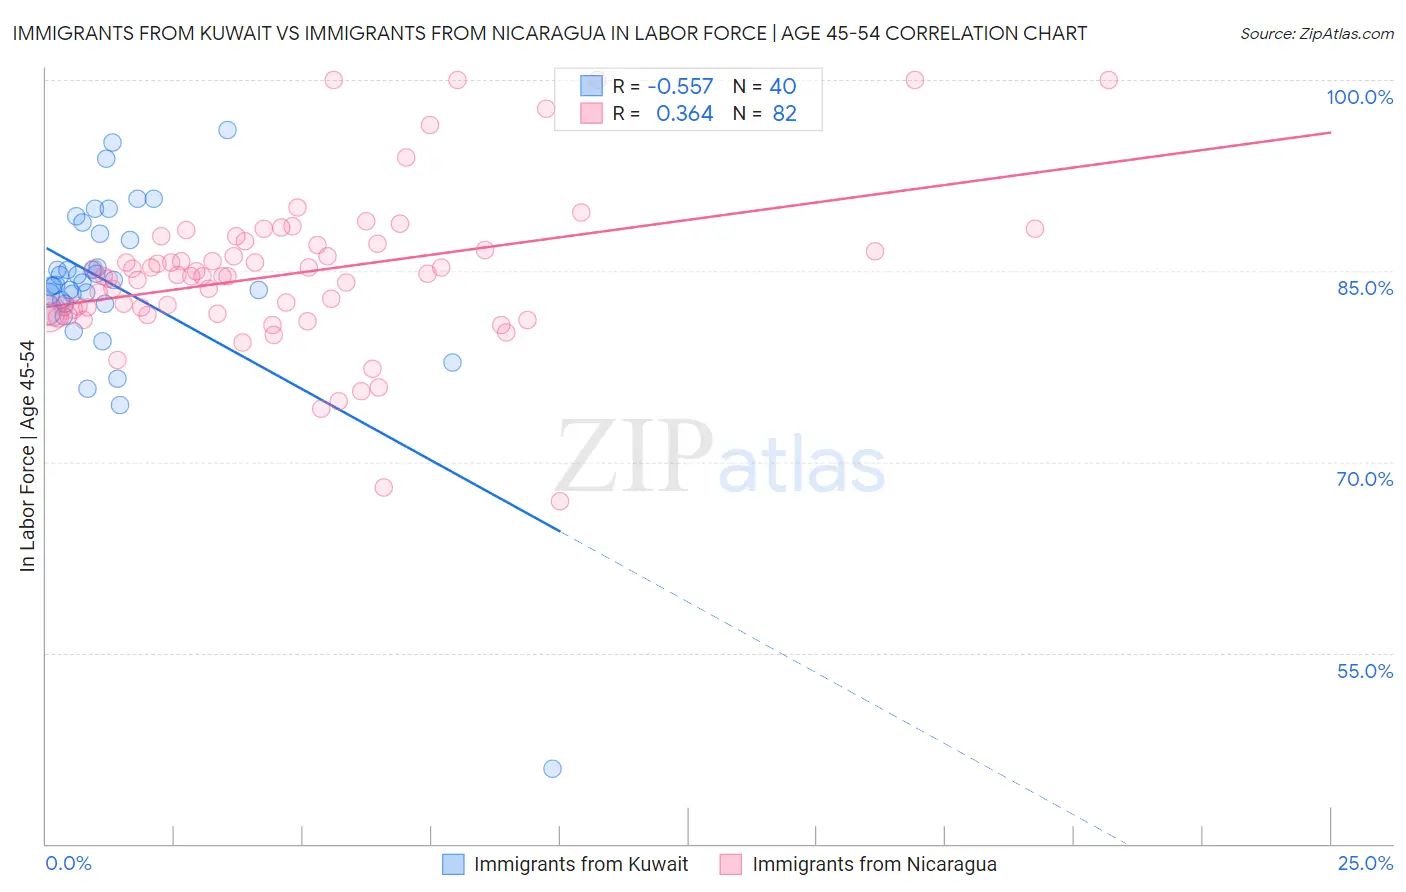
Immigrants from Kuwait vs Immigrants from Nicaragua In Labor Force | Age 45-54 Correlation Chart
The statistical analysis conducted on geographies consisting of 136,878,759 people shows a substantial negative correlation between the proportion of Immigrants from Kuwait and labor force participation rate among population between the ages 45 and 54 in the United States with a correlation coefficient (R) of -0.557 and weighted average of 83.3%. Similarly, the statistical analysis conducted on geographies consisting of 236,320,192 people shows a mild positive correlation between the proportion of Immigrants from Nicaragua and labor force participation rate among population between the ages 45 and 54 in the United States with a correlation coefficient (R) of 0.364 and weighted average of 82.7%, a difference of 0.69%.
In Labor Force | Age 45-54 Correlation Summary
| Measurement | Immigrants from Kuwait | Immigrants from Nicaragua |
| Minimum | 45.9% | 66.9% |
| Maximum | 96.1% | 100.0% |
| Range | 50.2% | 33.1% |
| Mean | 83.8% | 84.8% |
| Median | 84.0% | 84.6% |
| Interquartile 25% (IQ1) | 82.4% | 81.7% |
| Interquartile 75% (IQ3) | 87.7% | 87.1% |
| Interquartile Range (IQR) | 5.3% | 5.4% |
| Standard Deviation (Sample) | 7.8% | 6.2% |
| Standard Deviation (Population) | 7.7% | 6.1% |
Similar Demographics by In Labor Force | Age 45-54
Demographics Similar to Immigrants from Kuwait by In Labor Force | Age 45-54
In terms of in labor force | age 45-54, the demographic groups most similar to Immigrants from Kuwait are Immigrants from Argentina (83.3%, a difference of 0.0%), Palestinian (83.3%, a difference of 0.0%), Argentinean (83.3%, a difference of 0.010%), Danish (83.3%, a difference of 0.020%), and Italian (83.3%, a difference of 0.020%).
| Demographics | Rating | Rank | In Labor Force | Age 45-54 |
| Indians (Asian) | 95.5 /100 | #89 | Exceptional 83.3% |
| Immigrants | Japan | 95.5 /100 | #90 | Exceptional 83.3% |
| South Americans | 95.5 /100 | #91 | Exceptional 83.3% |
| Danes | 95.3 /100 | #92 | Exceptional 83.3% |
| Italians | 95.1 /100 | #93 | Exceptional 83.3% |
| Argentineans | 94.9 /100 | #94 | Exceptional 83.3% |
| Immigrants | Argentina | 94.9 /100 | #95 | Exceptional 83.3% |
| Immigrants | Kuwait | 94.8 /100 | #96 | Exceptional 83.3% |
| Palestinians | 94.8 /100 | #97 | Exceptional 83.3% |
| Maltese | 94.4 /100 | #98 | Exceptional 83.3% |
| Immigrants | Middle Africa | 94.3 /100 | #99 | Exceptional 83.3% |
| Mongolians | 94.2 /100 | #100 | Exceptional 83.3% |
| Immigrants | Belarus | 94.1 /100 | #101 | Exceptional 83.3% |
| Immigrants | Singapore | 93.9 /100 | #102 | Exceptional 83.3% |
| Albanians | 93.9 /100 | #103 | Exceptional 83.3% |
Demographics Similar to Immigrants from Nicaragua by In Labor Force | Age 45-54
In terms of in labor force | age 45-54, the demographic groups most similar to Immigrants from Nicaragua are Northern European (82.7%, a difference of 0.020%), Immigrants from Liberia (82.7%, a difference of 0.030%), Nigerian (82.7%, a difference of 0.040%), Nicaraguan (82.8%, a difference of 0.050%), and Costa Rican (82.8%, a difference of 0.050%).
| Demographics | Rating | Rank | In Labor Force | Age 45-54 |
| Pakistanis | 53.2 /100 | #170 | Average 82.8% |
| Immigrants | Zaire | 52.9 /100 | #171 | Average 82.8% |
| Icelanders | 51.8 /100 | #172 | Average 82.8% |
| Nicaraguans | 50.3 /100 | #173 | Average 82.8% |
| Costa Ricans | 50.0 /100 | #174 | Average 82.8% |
| Immigrants | Liberia | 47.9 /100 | #175 | Average 82.7% |
| Northern Europeans | 46.9 /100 | #176 | Average 82.7% |
| Immigrants | Nicaragua | 44.6 /100 | #177 | Average 82.7% |
| Nigerians | 40.5 /100 | #178 | Average 82.7% |
| Immigrants | Switzerland | 39.4 /100 | #179 | Fair 82.7% |
| Hungarians | 38.0 /100 | #180 | Fair 82.7% |
| Israelis | 37.7 /100 | #181 | Fair 82.7% |
| Immigrants | Hungary | 37.1 /100 | #182 | Fair 82.7% |
| New Zealanders | 32.7 /100 | #183 | Fair 82.6% |
| Europeans | 32.6 /100 | #184 | Fair 82.6% |