Immigrants from Kuwait vs Alaska Native In Labor Force | Age 45-54
COMPARE
Immigrants from Kuwait
Alaska Native
In Labor Force | Age 45-54
In Labor Force | Age 45-54 Comparison
Immigrants from Kuwait
Alaska Natives
83.3%
IN LABOR FORCE | AGE 45-54
94.8/ 100
METRIC RATING
96th/ 347
METRIC RANK
81.8%
IN LABOR FORCE | AGE 45-54
0.4/ 100
METRIC RATING
245th/ 347
METRIC RANK
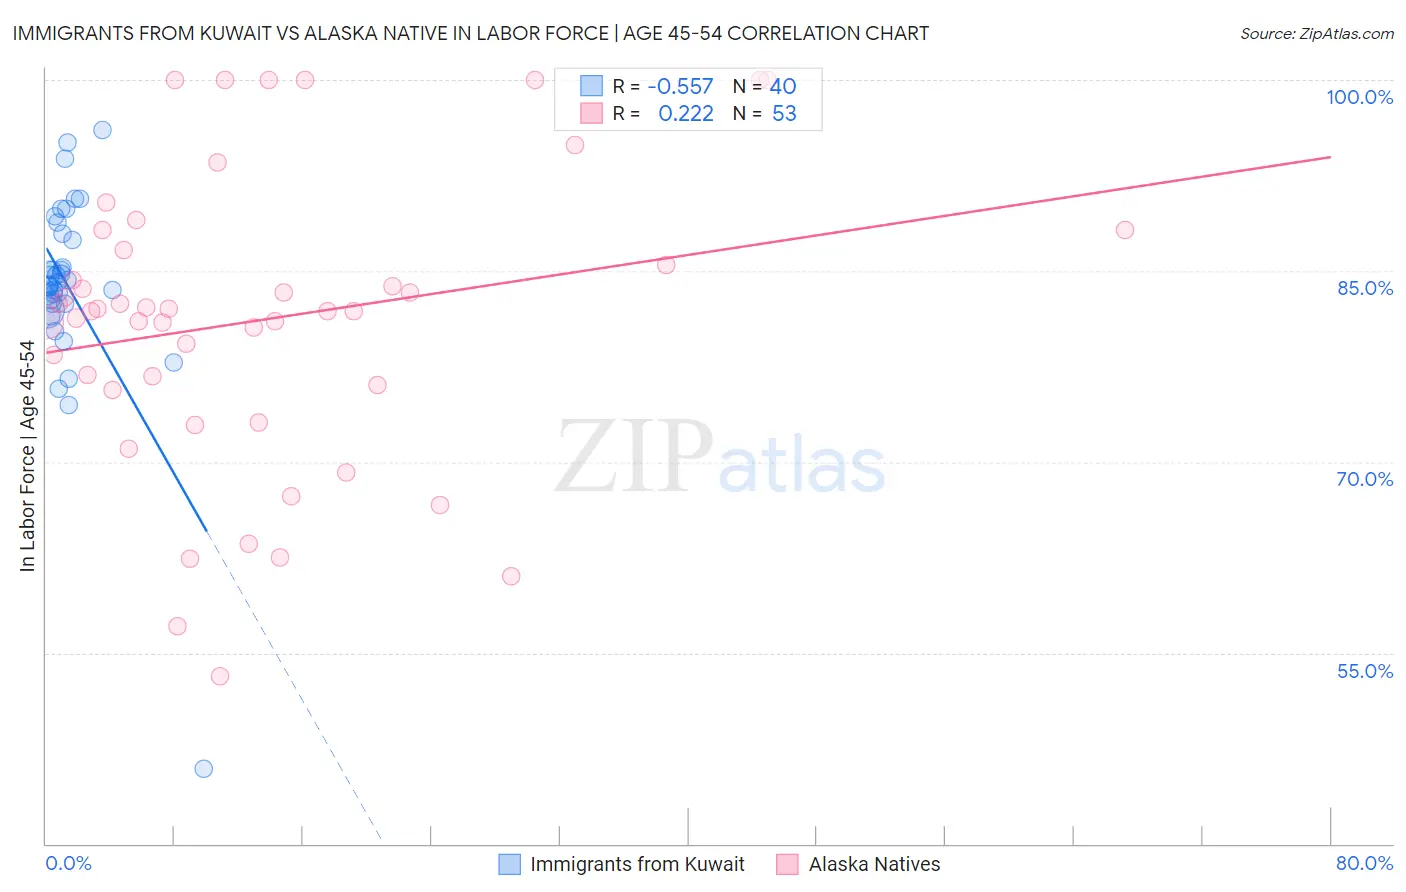
Immigrants from Kuwait vs Alaska Native In Labor Force | Age 45-54 Correlation Chart
The statistical analysis conducted on geographies consisting of 136,878,759 people shows a substantial negative correlation between the proportion of Immigrants from Kuwait and labor force participation rate among population between the ages 45 and 54 in the United States with a correlation coefficient (R) of -0.557 and weighted average of 83.3%. Similarly, the statistical analysis conducted on geographies consisting of 76,757,853 people shows a weak positive correlation between the proportion of Alaska Natives and labor force participation rate among population between the ages 45 and 54 in the United States with a correlation coefficient (R) of 0.222 and weighted average of 81.8%, a difference of 1.9%.
In Labor Force | Age 45-54 Correlation Summary
| Measurement | Immigrants from Kuwait | Alaska Native |
| Minimum | 45.9% | 53.1% |
| Maximum | 96.1% | 100.0% |
| Range | 50.2% | 46.9% |
| Mean | 83.8% | 81.2% |
| Median | 84.0% | 81.8% |
| Interquartile 25% (IQ1) | 82.4% | 75.8% |
| Interquartile 75% (IQ3) | 87.7% | 87.4% |
| Interquartile Range (IQR) | 5.3% | 11.6% |
| Standard Deviation (Sample) | 7.8% | 11.5% |
| Standard Deviation (Population) | 7.7% | 11.4% |
Similar Demographics by In Labor Force | Age 45-54
Demographics Similar to Immigrants from Kuwait by In Labor Force | Age 45-54
In terms of in labor force | age 45-54, the demographic groups most similar to Immigrants from Kuwait are Immigrants from Argentina (83.3%, a difference of 0.0%), Palestinian (83.3%, a difference of 0.0%), Argentinean (83.3%, a difference of 0.010%), Danish (83.3%, a difference of 0.020%), and Italian (83.3%, a difference of 0.020%).
| Demographics | Rating | Rank | In Labor Force | Age 45-54 |
| Indians (Asian) | 95.5 /100 | #89 | Exceptional 83.3% |
| Immigrants | Japan | 95.5 /100 | #90 | Exceptional 83.3% |
| South Americans | 95.5 /100 | #91 | Exceptional 83.3% |
| Danes | 95.3 /100 | #92 | Exceptional 83.3% |
| Italians | 95.1 /100 | #93 | Exceptional 83.3% |
| Argentineans | 94.9 /100 | #94 | Exceptional 83.3% |
| Immigrants | Argentina | 94.9 /100 | #95 | Exceptional 83.3% |
| Immigrants | Kuwait | 94.8 /100 | #96 | Exceptional 83.3% |
| Palestinians | 94.8 /100 | #97 | Exceptional 83.3% |
| Maltese | 94.4 /100 | #98 | Exceptional 83.3% |
| Immigrants | Middle Africa | 94.3 /100 | #99 | Exceptional 83.3% |
| Mongolians | 94.2 /100 | #100 | Exceptional 83.3% |
| Immigrants | Belarus | 94.1 /100 | #101 | Exceptional 83.3% |
| Immigrants | Singapore | 93.9 /100 | #102 | Exceptional 83.3% |
| Albanians | 93.9 /100 | #103 | Exceptional 83.3% |
Demographics Similar to Alaska Natives by In Labor Force | Age 45-54
In terms of in labor force | age 45-54, the demographic groups most similar to Alaska Natives are Celtic (81.8%, a difference of 0.010%), Alaskan Athabascan (81.8%, a difference of 0.010%), Central American (81.7%, a difference of 0.020%), Puget Sound Salish (81.7%, a difference of 0.050%), and Hmong (81.7%, a difference of 0.070%).
| Demographics | Rating | Rank | In Labor Force | Age 45-54 |
| Trinidadians and Tobagonians | 1.1 /100 | #238 | Tragic 81.9% |
| Immigrants | Thailand | 1.0 /100 | #239 | Tragic 81.9% |
| Immigrants | El Salvador | 1.0 /100 | #240 | Tragic 81.9% |
| Immigrants | Cambodia | 0.8 /100 | #241 | Tragic 81.9% |
| Whites/Caucasians | 0.7 /100 | #242 | Tragic 81.9% |
| Samoans | 0.6 /100 | #243 | Tragic 81.8% |
| Celtics | 0.4 /100 | #244 | Tragic 81.8% |
| Alaska Natives | 0.4 /100 | #245 | Tragic 81.8% |
| Alaskan Athabascans | 0.4 /100 | #246 | Tragic 81.8% |
| Central Americans | 0.4 /100 | #247 | Tragic 81.7% |
| Puget Sound Salish | 0.3 /100 | #248 | Tragic 81.7% |
| Hmong | 0.3 /100 | #249 | Tragic 81.7% |
| Immigrants | Armenia | 0.2 /100 | #250 | Tragic 81.7% |
| Guamanians/Chamorros | 0.2 /100 | #251 | Tragic 81.6% |
| Pennsylvania Germans | 0.2 /100 | #252 | Tragic 81.6% |