Immigrants from Kuwait vs Immigrants from Armenia In Labor Force | Age 35-44
COMPARE
Immigrants from Kuwait
Immigrants from Armenia
In Labor Force | Age 35-44
In Labor Force | Age 35-44 Comparison
Immigrants from Kuwait
Immigrants from Armenia
84.8%
IN LABOR FORCE | AGE 35-44
96.7/ 100
METRIC RATING
95th/ 347
METRIC RANK
83.7%
IN LABOR FORCE | AGE 35-44
0.9/ 100
METRIC RATING
247th/ 347
METRIC RANK
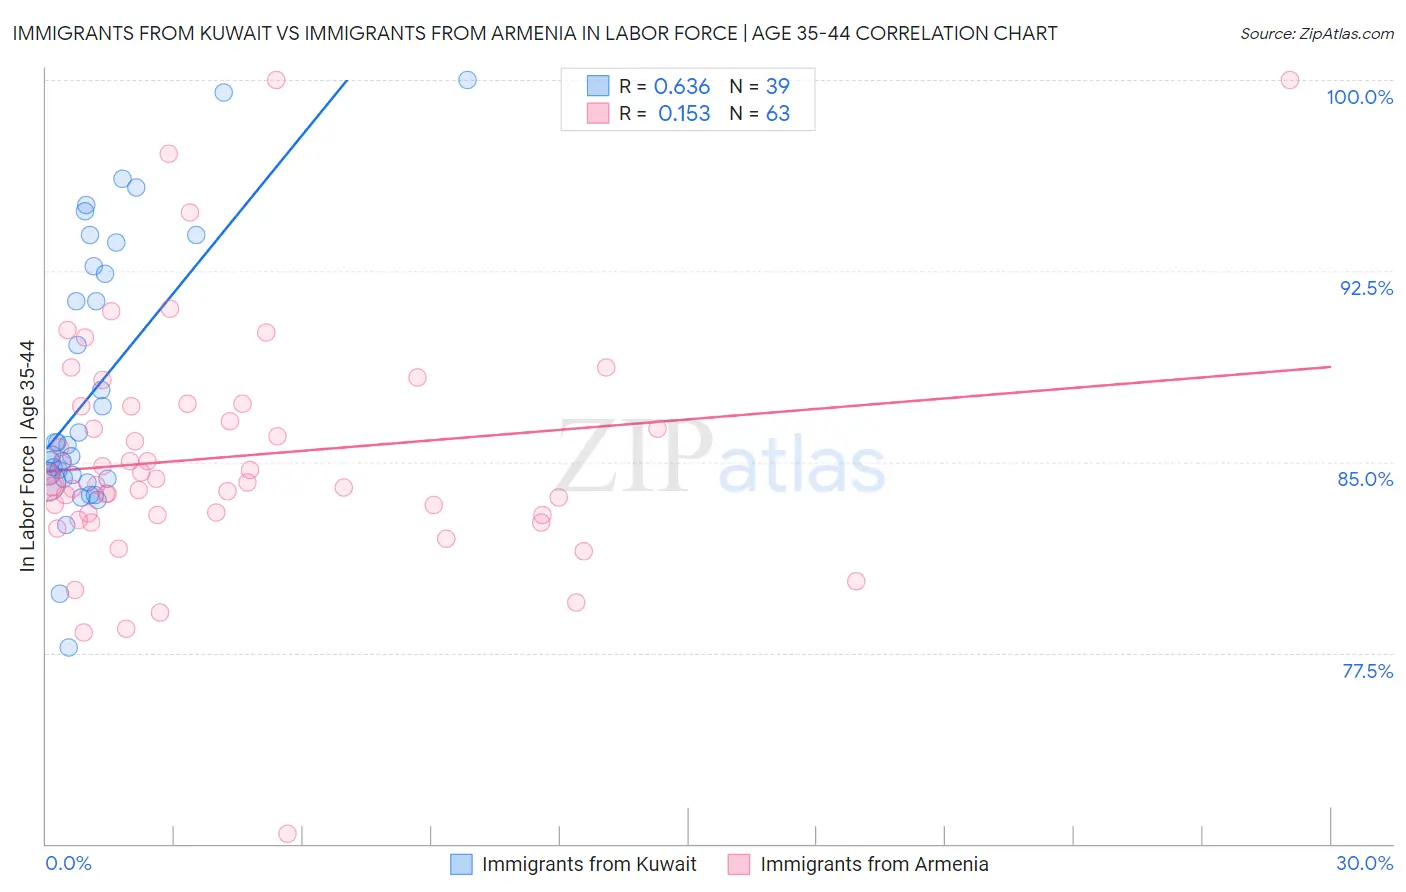
Immigrants from Kuwait vs Immigrants from Armenia In Labor Force | Age 35-44 Correlation Chart
The statistical analysis conducted on geographies consisting of 136,880,462 people shows a significant positive correlation between the proportion of Immigrants from Kuwait and labor force participation rate among population between the ages 35 and 44 in the United States with a correlation coefficient (R) of 0.636 and weighted average of 84.8%. Similarly, the statistical analysis conducted on geographies consisting of 97,711,872 people shows a poor positive correlation between the proportion of Immigrants from Armenia and labor force participation rate among population between the ages 35 and 44 in the United States with a correlation coefficient (R) of 0.153 and weighted average of 83.7%, a difference of 1.3%.
In Labor Force | Age 35-44 Correlation Summary
| Measurement | Immigrants from Kuwait | Immigrants from Armenia |
| Minimum | 77.7% | 70.4% |
| Maximum | 100.0% | 100.0% |
| Range | 22.3% | 29.6% |
| Mean | 87.9% | 85.2% |
| Median | 85.6% | 84.2% |
| Interquartile 25% (IQ1) | 84.4% | 82.9% |
| Interquartile 75% (IQ3) | 92.7% | 87.2% |
| Interquartile Range (IQR) | 8.3% | 4.3% |
| Standard Deviation (Sample) | 5.4% | 4.8% |
| Standard Deviation (Population) | 5.3% | 4.8% |
Similar Demographics by In Labor Force | Age 35-44
Demographics Similar to Immigrants from Kuwait by In Labor Force | Age 35-44
In terms of in labor force | age 35-44, the demographic groups most similar to Immigrants from Kuwait are Cuban (84.8%, a difference of 0.0%), Egyptian (84.8%, a difference of 0.0%), Mongolian (84.8%, a difference of 0.010%), Immigrants from Northern Africa (84.8%, a difference of 0.020%), and Immigrants from Europe (84.9%, a difference of 0.030%).
| Demographics | Rating | Rank | In Labor Force | Age 35-44 |
| Yugoslavians | 97.7 /100 | #88 | Exceptional 84.9% |
| Immigrants | Pakistan | 97.5 /100 | #89 | Exceptional 84.9% |
| Immigrants | France | 97.4 /100 | #90 | Exceptional 84.9% |
| Immigrants | Europe | 97.2 /100 | #91 | Exceptional 84.9% |
| Ghanaians | 97.2 /100 | #92 | Exceptional 84.8% |
| Immigrants | Northern Africa | 97.1 /100 | #93 | Exceptional 84.8% |
| Mongolians | 96.8 /100 | #94 | Exceptional 84.8% |
| Immigrants | Kuwait | 96.7 /100 | #95 | Exceptional 84.8% |
| Cubans | 96.6 /100 | #96 | Exceptional 84.8% |
| Egyptians | 96.6 /100 | #97 | Exceptional 84.8% |
| Indians (Asian) | 96.1 /100 | #98 | Exceptional 84.8% |
| Haitians | 96.0 /100 | #99 | Exceptional 84.8% |
| Immigrants | Czechoslovakia | 95.9 /100 | #100 | Exceptional 84.8% |
| Immigrants | Australia | 95.5 /100 | #101 | Exceptional 84.8% |
| Immigrants | Southern Europe | 95.3 /100 | #102 | Exceptional 84.8% |
Demographics Similar to Immigrants from Armenia by In Labor Force | Age 35-44
In terms of in labor force | age 35-44, the demographic groups most similar to Immigrants from Armenia are Immigrants (83.7%, a difference of 0.020%), Indonesian (83.7%, a difference of 0.020%), Immigrants from Western Asia (83.8%, a difference of 0.030%), Guyanese (83.8%, a difference of 0.030%), and Malaysian (83.8%, a difference of 0.030%).
| Demographics | Rating | Rank | In Labor Force | Age 35-44 |
| Arabs | 1.3 /100 | #240 | Tragic 83.8% |
| Iraqis | 1.3 /100 | #241 | Tragic 83.8% |
| Immigrants | Cambodia | 1.1 /100 | #242 | Tragic 83.8% |
| Immigrants | Western Asia | 1.1 /100 | #243 | Tragic 83.8% |
| Guyanese | 1.1 /100 | #244 | Tragic 83.8% |
| Malaysians | 1.1 /100 | #245 | Tragic 83.8% |
| Immigrants | Immigrants | 1.0 /100 | #246 | Tragic 83.7% |
| Immigrants | Armenia | 0.9 /100 | #247 | Tragic 83.7% |
| Indonesians | 0.8 /100 | #248 | Tragic 83.7% |
| Immigrants | St. Vincent and the Grenadines | 0.7 /100 | #249 | Tragic 83.7% |
| Whites/Caucasians | 0.5 /100 | #250 | Tragic 83.6% |
| Salvadorans | 0.4 /100 | #251 | Tragic 83.6% |
| Immigrants | Guyana | 0.4 /100 | #252 | Tragic 83.6% |
| Lebanese | 0.4 /100 | #253 | Tragic 83.6% |
| Tongans | 0.4 /100 | #254 | Tragic 83.6% |