Colombian vs Scandinavian In Labor Force | Age 20-64
COMPARE
Colombian
Scandinavian
In Labor Force | Age 20-64
In Labor Force | Age 20-64 Comparison
Colombians
Scandinavians
80.1%
IN LABOR FORCE | AGE 20-64
97.3/ 100
METRIC RATING
83rd/ 347
METRIC RANK
79.7%
IN LABOR FORCE | AGE 20-64
72.0/ 100
METRIC RATING
151st/ 347
METRIC RANK
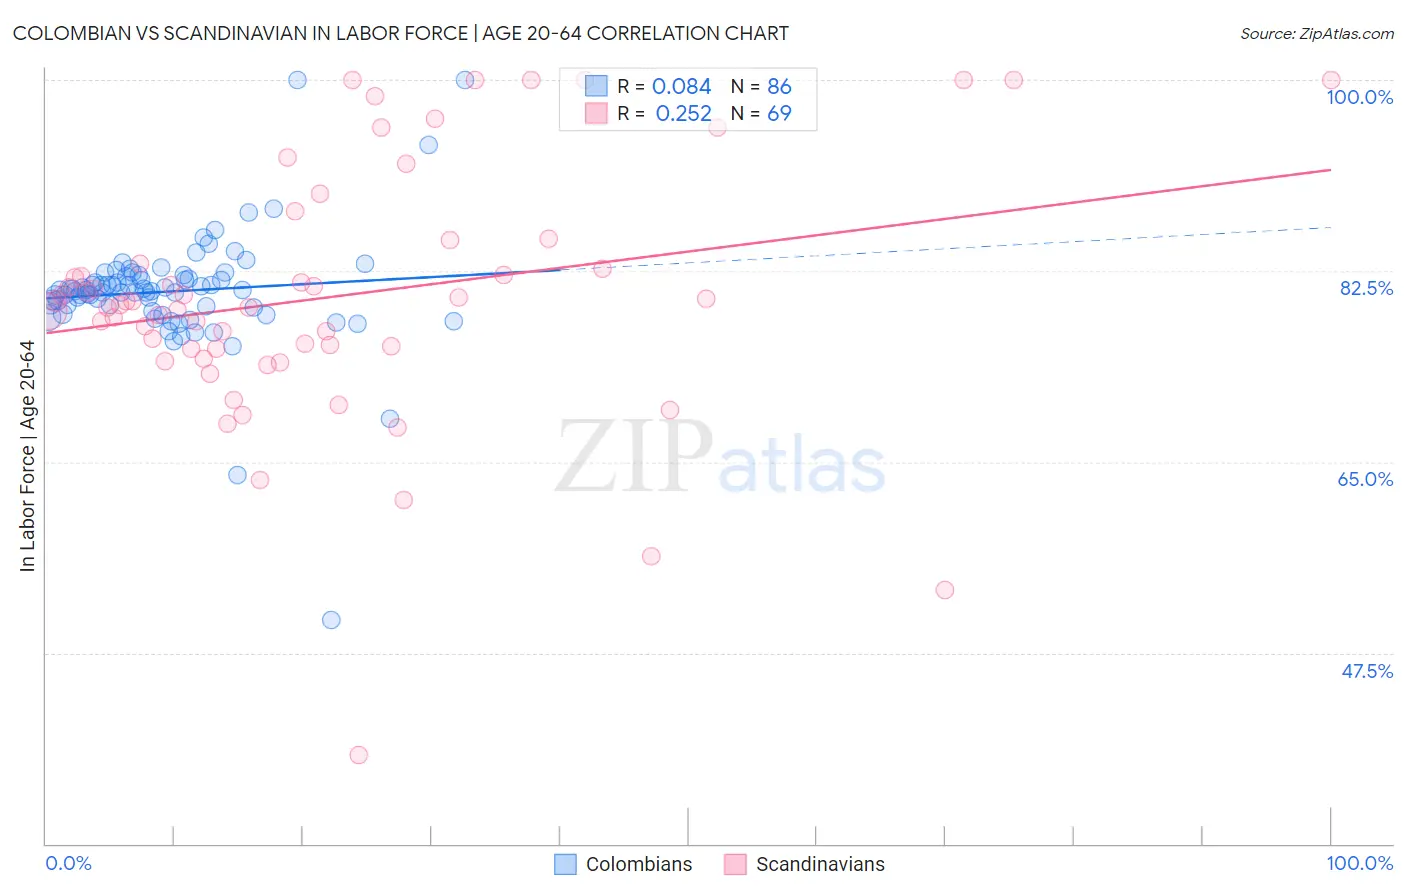
Colombian vs Scandinavian In Labor Force | Age 20-64 Correlation Chart
The statistical analysis conducted on geographies consisting of 419,691,663 people shows a slight positive correlation between the proportion of Colombians and labor force participation rate among population between the ages 20 and 64 in the United States with a correlation coefficient (R) of 0.084 and weighted average of 80.1%. Similarly, the statistical analysis conducted on geographies consisting of 472,639,714 people shows a weak positive correlation between the proportion of Scandinavians and labor force participation rate among population between the ages 20 and 64 in the United States with a correlation coefficient (R) of 0.252 and weighted average of 79.7%, a difference of 0.53%.
In Labor Force | Age 20-64 Correlation Summary
| Measurement | Colombian | Scandinavian |
| Minimum | 50.5% | 38.1% |
| Maximum | 100.0% | 100.0% |
| Range | 49.5% | 61.9% |
| Mean | 80.6% | 80.1% |
| Median | 80.7% | 79.7% |
| Interquartile 25% (IQ1) | 79.2% | 75.4% |
| Interquartile 75% (IQ3) | 82.0% | 84.3% |
| Interquartile Range (IQR) | 2.8% | 8.9% |
| Standard Deviation (Sample) | 5.7% | 11.6% |
| Standard Deviation (Population) | 5.6% | 11.5% |
Similar Demographics by In Labor Force | Age 20-64
Demographics Similar to Colombians by In Labor Force | Age 20-64
In terms of in labor force | age 20-64, the demographic groups most similar to Colombians are German Russian (80.1%, a difference of 0.0%), Immigrants from Japan (80.1%, a difference of 0.0%), Immigrants from Latvia (80.1%, a difference of 0.0%), Jordanian (80.1%, a difference of 0.010%), and Immigrants from Egypt (80.1%, a difference of 0.010%).
| Demographics | Rating | Rank | In Labor Force | Age 20-64 |
| Egyptians | 97.8 /100 | #76 | Exceptional 80.2% |
| Immigrants | Colombia | 97.8 /100 | #77 | Exceptional 80.2% |
| Immigrants | Romania | 97.8 /100 | #78 | Exceptional 80.2% |
| Asians | 97.7 /100 | #79 | Exceptional 80.2% |
| Immigrants | Croatia | 97.6 /100 | #80 | Exceptional 80.1% |
| German Russians | 97.3 /100 | #81 | Exceptional 80.1% |
| Immigrants | Japan | 97.3 /100 | #82 | Exceptional 80.1% |
| Colombians | 97.3 /100 | #83 | Exceptional 80.1% |
| Immigrants | Latvia | 97.2 /100 | #84 | Exceptional 80.1% |
| Jordanians | 97.2 /100 | #85 | Exceptional 80.1% |
| Immigrants | Egypt | 97.1 /100 | #86 | Exceptional 80.1% |
| Croatians | 97.1 /100 | #87 | Exceptional 80.1% |
| Chileans | 97.0 /100 | #88 | Exceptional 80.1% |
| Immigrants | Venezuela | 96.8 /100 | #89 | Exceptional 80.1% |
| Poles | 96.8 /100 | #90 | Exceptional 80.1% |
Demographics Similar to Scandinavians by In Labor Force | Age 20-64
In terms of in labor force | age 20-64, the demographic groups most similar to Scandinavians are Costa Rican (79.7%, a difference of 0.0%), Immigrants from Northern Europe (79.7%, a difference of 0.0%), Immigrants from Kazakhstan (79.7%, a difference of 0.020%), Icelander (79.7%, a difference of 0.030%), and New Zealander (79.7%, a difference of 0.030%).
| Demographics | Rating | Rank | In Labor Force | Age 20-64 |
| Koreans | 79.6 /100 | #144 | Good 79.8% |
| Pakistanis | 79.3 /100 | #145 | Good 79.8% |
| Immigrants | Southern Europe | 78.9 /100 | #146 | Good 79.8% |
| Immigrants | Philippines | 78.0 /100 | #147 | Good 79.8% |
| Romanians | 77.6 /100 | #148 | Good 79.8% |
| Icelanders | 75.1 /100 | #149 | Good 79.7% |
| Costa Ricans | 72.4 /100 | #150 | Good 79.7% |
| Scandinavians | 72.0 /100 | #151 | Good 79.7% |
| Immigrants | Northern Europe | 72.0 /100 | #152 | Good 79.7% |
| Immigrants | Kazakhstan | 69.5 /100 | #153 | Good 79.7% |
| New Zealanders | 69.4 /100 | #154 | Good 79.7% |
| Immigrants | South Africa | 69.2 /100 | #155 | Good 79.7% |
| Senegalese | 69.1 /100 | #156 | Good 79.7% |
| Immigrants | China | 69.1 /100 | #157 | Good 79.7% |
| Austrians | 67.6 /100 | #158 | Good 79.7% |