Immigrants from Bangladesh vs Scandinavian In Labor Force | Age 20-64
COMPARE
Immigrants from Bangladesh
Scandinavian
In Labor Force | Age 20-64
In Labor Force | Age 20-64 Comparison
Immigrants from Bangladesh
Scandinavians
77.9%
IN LABOR FORCE | AGE 20-64
0.0/ 100
METRIC RATING
290th/ 347
METRIC RANK
79.7%
IN LABOR FORCE | AGE 20-64
72.0/ 100
METRIC RATING
151st/ 347
METRIC RANK
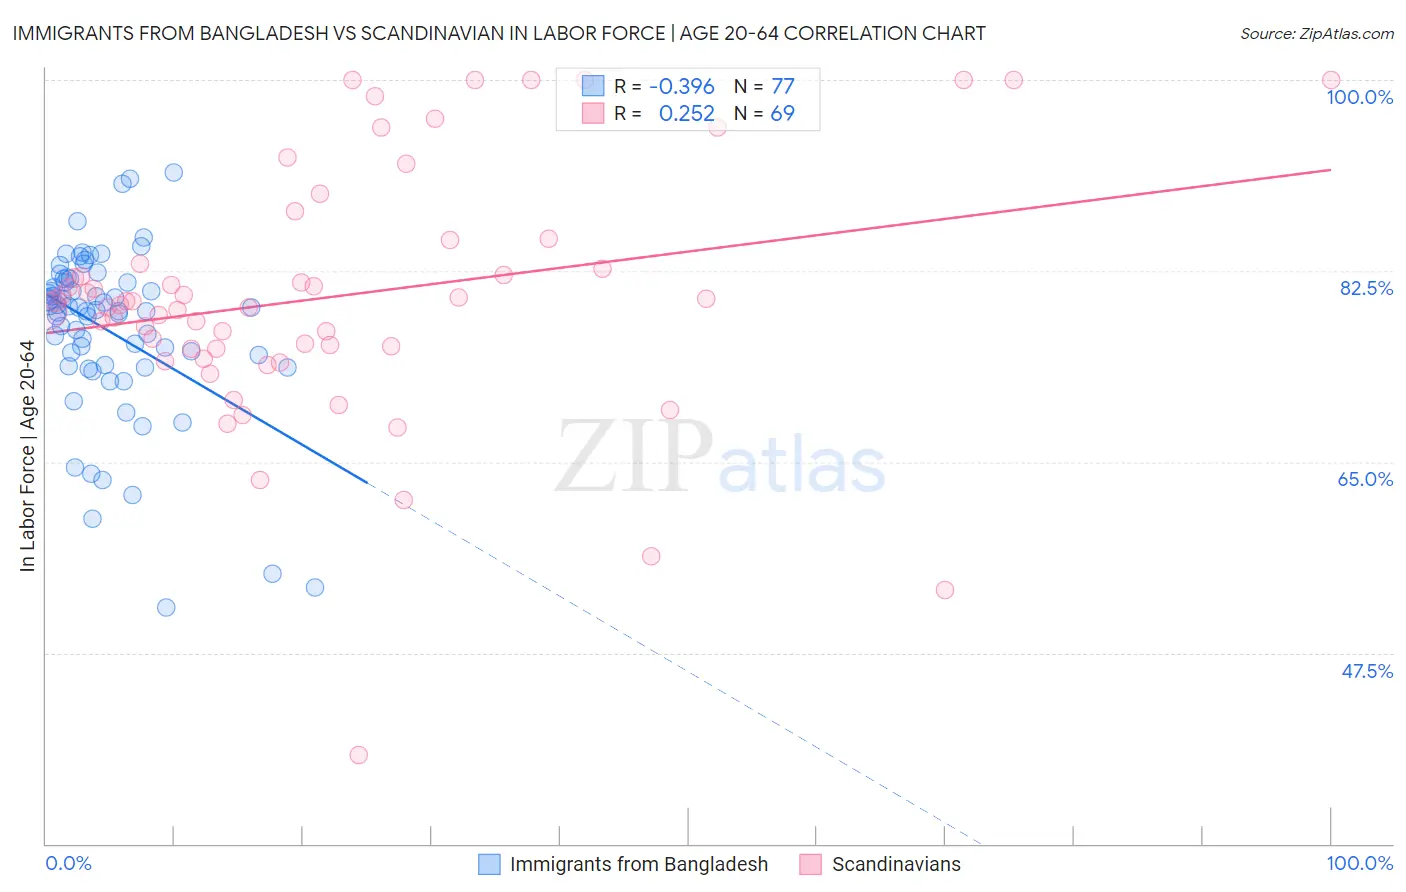
Immigrants from Bangladesh vs Scandinavian In Labor Force | Age 20-64 Correlation Chart
The statistical analysis conducted on geographies consisting of 203,682,121 people shows a mild negative correlation between the proportion of Immigrants from Bangladesh and labor force participation rate among population between the ages 20 and 64 in the United States with a correlation coefficient (R) of -0.396 and weighted average of 77.9%. Similarly, the statistical analysis conducted on geographies consisting of 472,639,714 people shows a weak positive correlation between the proportion of Scandinavians and labor force participation rate among population between the ages 20 and 64 in the United States with a correlation coefficient (R) of 0.252 and weighted average of 79.7%, a difference of 2.3%.
In Labor Force | Age 20-64 Correlation Summary
| Measurement | Immigrants from Bangladesh | Scandinavian |
| Minimum | 51.6% | 38.1% |
| Maximum | 91.5% | 100.0% |
| Range | 39.9% | 61.9% |
| Mean | 77.1% | 80.1% |
| Median | 78.9% | 79.7% |
| Interquartile 25% (IQ1) | 73.8% | 75.4% |
| Interquartile 75% (IQ3) | 81.6% | 84.3% |
| Interquartile Range (IQR) | 7.8% | 8.9% |
| Standard Deviation (Sample) | 7.8% | 11.6% |
| Standard Deviation (Population) | 7.8% | 11.5% |
Similar Demographics by In Labor Force | Age 20-64
Demographics Similar to Immigrants from Bangladesh by In Labor Force | Age 20-64
In terms of in labor force | age 20-64, the demographic groups most similar to Immigrants from Bangladesh are African (77.9%, a difference of 0.010%), Hmong (77.9%, a difference of 0.020%), Spanish American (77.8%, a difference of 0.050%), Immigrants from Belize (78.0%, a difference of 0.10%), and Vietnamese (78.0%, a difference of 0.10%).
| Demographics | Rating | Rank | In Labor Force | Age 20-64 |
| Immigrants | Nonimmigrants | 0.0 /100 | #283 | Tragic 78.1% |
| Immigrants | Guyana | 0.0 /100 | #284 | Tragic 78.1% |
| Osage | 0.0 /100 | #285 | Tragic 78.0% |
| Immigrants | Belize | 0.0 /100 | #286 | Tragic 78.0% |
| Vietnamese | 0.0 /100 | #287 | Tragic 78.0% |
| Hmong | 0.0 /100 | #288 | Tragic 77.9% |
| Africans | 0.0 /100 | #289 | Tragic 77.9% |
| Immigrants | Bangladesh | 0.0 /100 | #290 | Tragic 77.9% |
| Spanish Americans | 0.0 /100 | #291 | Tragic 77.8% |
| Immigrants | Azores | 0.0 /100 | #292 | Tragic 77.8% |
| Delaware | 0.0 /100 | #293 | Tragic 77.8% |
| Immigrants | Central America | 0.0 /100 | #294 | Tragic 77.7% |
| Immigrants | Grenada | 0.0 /100 | #295 | Tragic 77.7% |
| Immigrants | Dominican Republic | 0.0 /100 | #296 | Tragic 77.7% |
| Dominicans | 0.0 /100 | #297 | Tragic 77.7% |
Demographics Similar to Scandinavians by In Labor Force | Age 20-64
In terms of in labor force | age 20-64, the demographic groups most similar to Scandinavians are Costa Rican (79.7%, a difference of 0.0%), Immigrants from Northern Europe (79.7%, a difference of 0.0%), Immigrants from Kazakhstan (79.7%, a difference of 0.020%), Icelander (79.7%, a difference of 0.030%), and New Zealander (79.7%, a difference of 0.030%).
| Demographics | Rating | Rank | In Labor Force | Age 20-64 |
| Koreans | 79.6 /100 | #144 | Good 79.8% |
| Pakistanis | 79.3 /100 | #145 | Good 79.8% |
| Immigrants | Southern Europe | 78.9 /100 | #146 | Good 79.8% |
| Immigrants | Philippines | 78.0 /100 | #147 | Good 79.8% |
| Romanians | 77.6 /100 | #148 | Good 79.8% |
| Icelanders | 75.1 /100 | #149 | Good 79.7% |
| Costa Ricans | 72.4 /100 | #150 | Good 79.7% |
| Scandinavians | 72.0 /100 | #151 | Good 79.7% |
| Immigrants | Northern Europe | 72.0 /100 | #152 | Good 79.7% |
| Immigrants | Kazakhstan | 69.5 /100 | #153 | Good 79.7% |
| New Zealanders | 69.4 /100 | #154 | Good 79.7% |
| Immigrants | South Africa | 69.2 /100 | #155 | Good 79.7% |
| Senegalese | 69.1 /100 | #156 | Good 79.7% |
| Immigrants | China | 69.1 /100 | #157 | Good 79.7% |
| Austrians | 67.6 /100 | #158 | Good 79.7% |