Nonimmigrants vs Immigrants from Peru In Labor Force | Age > 16
COMPARE
Nonimmigrants
Immigrants from Peru
In Labor Force | Age > 16
In Labor Force | Age > 16 Comparison
Nonimmigrants
Immigrants from Peru
63.5%
IN LABOR FORCE | AGE > 16
0.0/ 100
METRIC RATING
304th/ 347
METRIC RANK
66.3%
IN LABOR FORCE | AGE > 16
99.8/ 100
METRIC RATING
60th/ 347
METRIC RANK
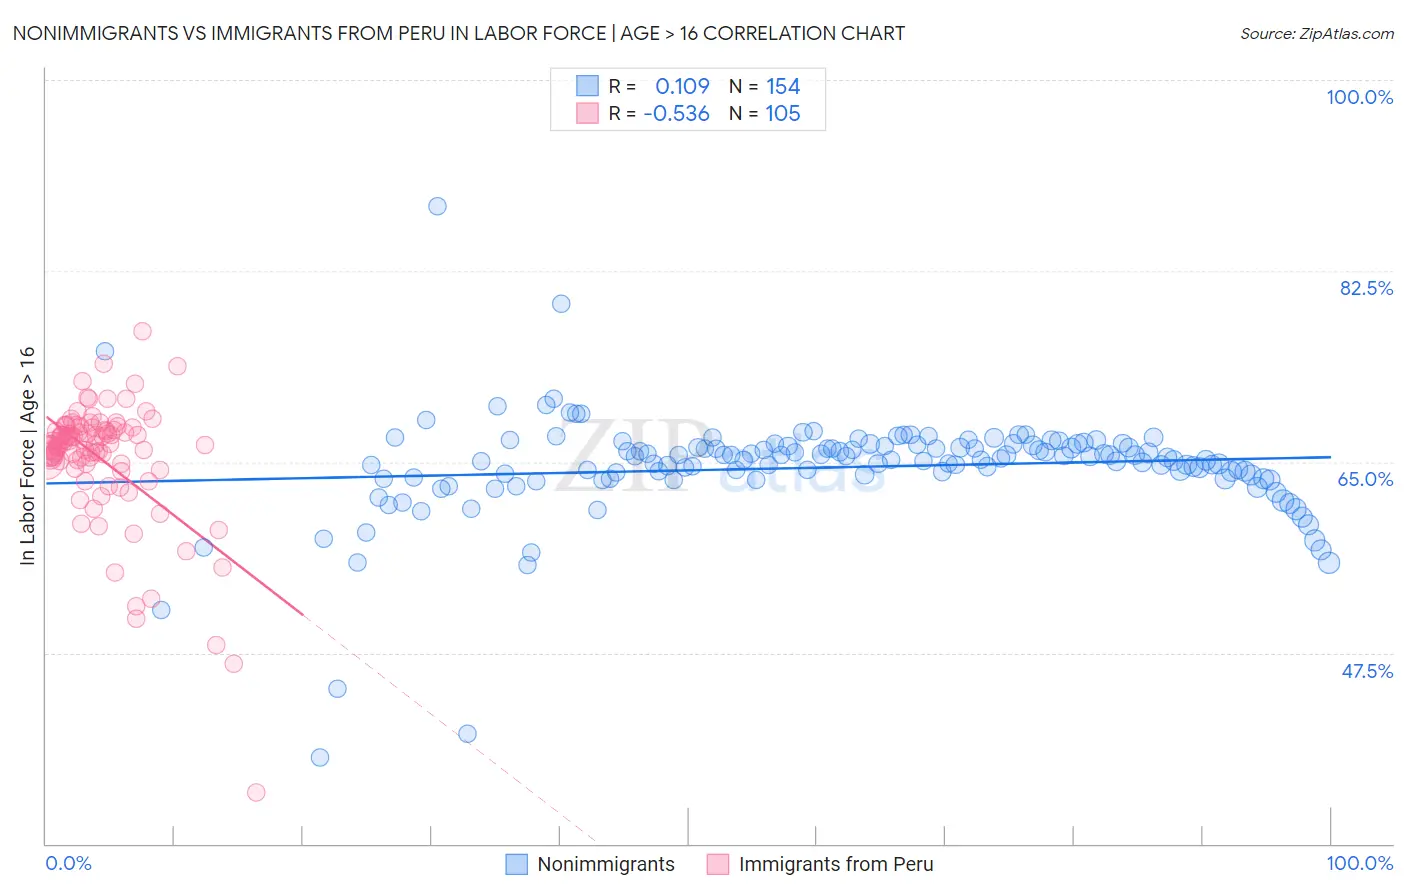
Nonimmigrants vs Immigrants from Peru In Labor Force | Age > 16 Correlation Chart
The statistical analysis conducted on geographies consisting of 585,341,591 people shows a poor positive correlation between the proportion of Nonimmigrants and labor force participation rate among population ages 16 and over in the United States with a correlation coefficient (R) of 0.109 and weighted average of 63.5%. Similarly, the statistical analysis conducted on geographies consisting of 328,856,106 people shows a substantial negative correlation between the proportion of Immigrants from Peru and labor force participation rate among population ages 16 and over in the United States with a correlation coefficient (R) of -0.536 and weighted average of 66.3%, a difference of 4.4%.
In Labor Force | Age > 16 Correlation Summary
| Measurement | Nonimmigrants | Immigrants from Peru |
| Minimum | 37.9% | 34.7% |
| Maximum | 88.4% | 77.0% |
| Range | 50.5% | 42.3% |
| Mean | 64.5% | 65.3% |
| Median | 65.2% | 66.7% |
| Interquartile 25% (IQ1) | 63.5% | 64.8% |
| Interquartile 75% (IQ3) | 66.5% | 68.1% |
| Interquartile Range (IQR) | 3.0% | 3.2% |
| Standard Deviation (Sample) | 5.1% | 5.8% |
| Standard Deviation (Population) | 5.1% | 5.8% |
Similar Demographics by In Labor Force | Age > 16
Demographics Similar to Nonimmigrants by In Labor Force | Age > 16
In terms of in labor force | age > 16, the demographic groups most similar to Nonimmigrants are Cree (63.5%, a difference of 0.050%), Osage (63.5%, a difference of 0.050%), Delaware (63.6%, a difference of 0.090%), Spanish American (63.6%, a difference of 0.11%), and Immigrants from the Azores (63.6%, a difference of 0.13%).
| Demographics | Rating | Rank | In Labor Force | Age > 16 |
| Immigrants | Grenada | 0.0 /100 | #297 | Tragic 63.6% |
| Comanche | 0.0 /100 | #298 | Tragic 63.6% |
| Whites/Caucasians | 0.0 /100 | #299 | Tragic 63.6% |
| Immigrants | Azores | 0.0 /100 | #300 | Tragic 63.6% |
| Spanish Americans | 0.0 /100 | #301 | Tragic 63.6% |
| Delaware | 0.0 /100 | #302 | Tragic 63.6% |
| Cree | 0.0 /100 | #303 | Tragic 63.5% |
| Immigrants | Nonimmigrants | 0.0 /100 | #304 | Tragic 63.5% |
| Osage | 0.0 /100 | #305 | Tragic 63.5% |
| Blacks/African Americans | 0.0 /100 | #306 | Tragic 63.4% |
| Central American Indians | 0.0 /100 | #307 | Tragic 63.4% |
| Pennsylvania Germans | 0.0 /100 | #308 | Tragic 63.4% |
| Scotch-Irish | 0.0 /100 | #309 | Tragic 63.3% |
| Shoshone | 0.0 /100 | #310 | Tragic 63.2% |
| Blackfeet | 0.0 /100 | #311 | Tragic 63.2% |
Demographics Similar to Immigrants from Peru by In Labor Force | Age > 16
In terms of in labor force | age > 16, the demographic groups most similar to Immigrants from Peru are Immigrants from Burma/Myanmar (66.3%, a difference of 0.0%), Indonesian (66.3%, a difference of 0.0%), Immigrants from Turkey (66.3%, a difference of 0.020%), Venezuelan (66.3%, a difference of 0.040%), and Peruvian (66.3%, a difference of 0.040%).
| Demographics | Rating | Rank | In Labor Force | Age > 16 |
| Immigrants | Sri Lanka | 99.9 /100 | #53 | Exceptional 66.5% |
| Immigrants | Bosnia and Herzegovina | 99.9 /100 | #54 | Exceptional 66.5% |
| Immigrants | Venezuela | 99.9 /100 | #55 | Exceptional 66.4% |
| Immigrants | Senegal | 99.9 /100 | #56 | Exceptional 66.4% |
| Bulgarians | 99.9 /100 | #57 | Exceptional 66.4% |
| Immigrants | Saudi Arabia | 99.9 /100 | #58 | Exceptional 66.3% |
| Immigrants | Turkey | 99.9 /100 | #59 | Exceptional 66.3% |
| Immigrants | Peru | 99.8 /100 | #60 | Exceptional 66.3% |
| Immigrants | Burma/Myanmar | 99.8 /100 | #61 | Exceptional 66.3% |
| Indonesians | 99.8 /100 | #62 | Exceptional 66.3% |
| Venezuelans | 99.8 /100 | #63 | Exceptional 66.3% |
| Peruvians | 99.8 /100 | #64 | Exceptional 66.3% |
| Sri Lankans | 99.8 /100 | #65 | Exceptional 66.3% |
| Jordanians | 99.8 /100 | #66 | Exceptional 66.3% |
| Egyptians | 99.8 /100 | #67 | Exceptional 66.2% |