Immigrants from Southern Europe vs Immigrants from Peru In Labor Force | Age > 16
COMPARE
Immigrants from Southern Europe
Immigrants from Peru
In Labor Force | Age > 16
In Labor Force | Age > 16 Comparison
Immigrants from Southern Europe
Immigrants from Peru
65.0%
IN LABOR FORCE | AGE > 16
31.3/ 100
METRIC RATING
194th/ 347
METRIC RANK
66.3%
IN LABOR FORCE | AGE > 16
99.8/ 100
METRIC RATING
60th/ 347
METRIC RANK
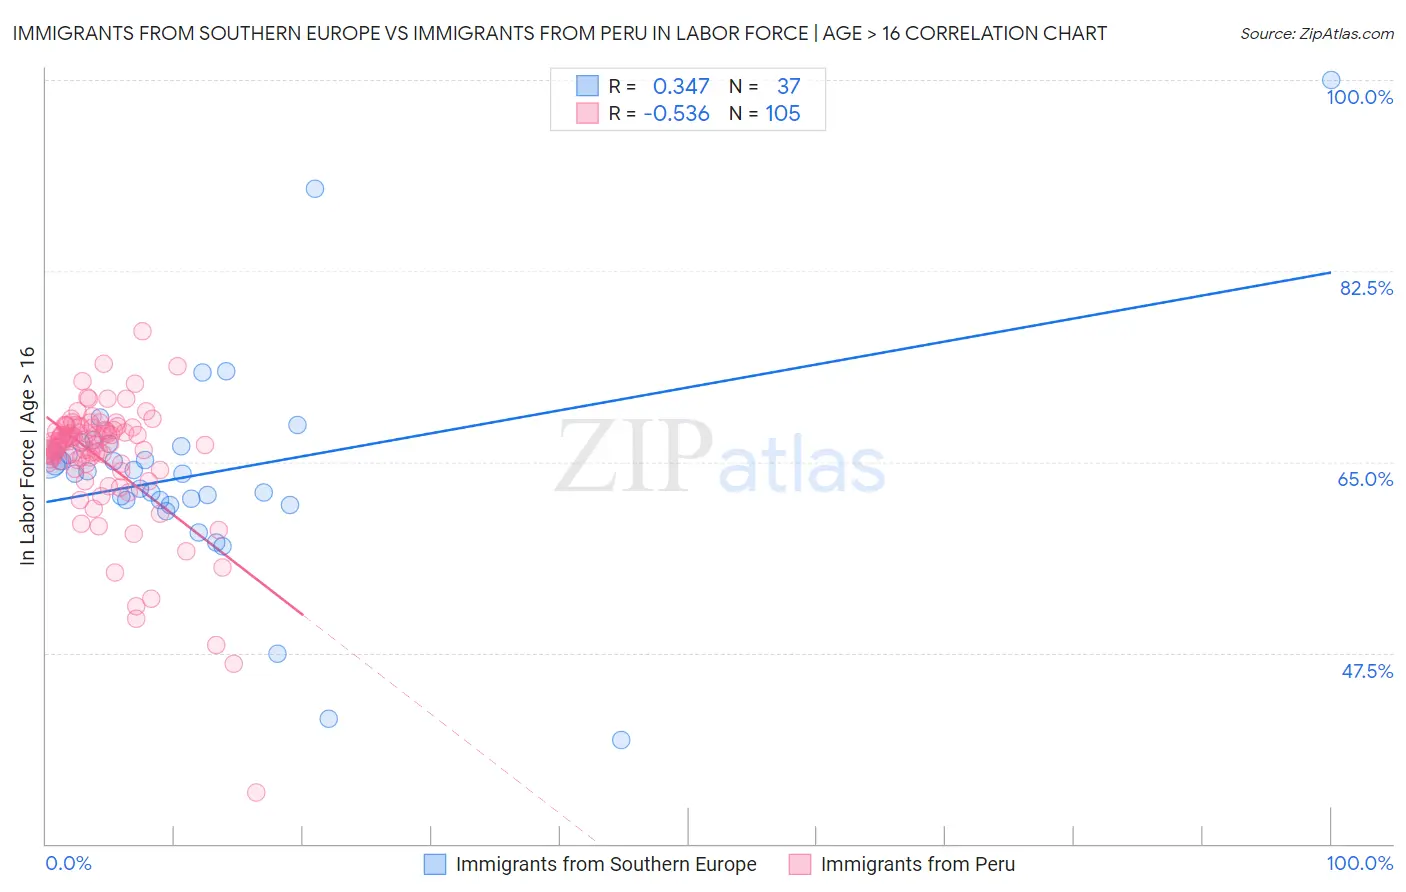
Immigrants from Southern Europe vs Immigrants from Peru In Labor Force | Age > 16 Correlation Chart
The statistical analysis conducted on geographies consisting of 402,799,344 people shows a mild positive correlation between the proportion of Immigrants from Southern Europe and labor force participation rate among population ages 16 and over in the United States with a correlation coefficient (R) of 0.347 and weighted average of 65.0%. Similarly, the statistical analysis conducted on geographies consisting of 328,856,106 people shows a substantial negative correlation between the proportion of Immigrants from Peru and labor force participation rate among population ages 16 and over in the United States with a correlation coefficient (R) of -0.536 and weighted average of 66.3%, a difference of 2.0%.
In Labor Force | Age > 16 Correlation Summary
| Measurement | Immigrants from Southern Europe | Immigrants from Peru |
| Minimum | 39.5% | 34.7% |
| Maximum | 100.0% | 77.0% |
| Range | 60.5% | 42.3% |
| Mean | 64.0% | 65.3% |
| Median | 63.9% | 66.7% |
| Interquartile 25% (IQ1) | 61.3% | 64.8% |
| Interquartile 75% (IQ3) | 66.6% | 68.1% |
| Interquartile Range (IQR) | 5.2% | 3.2% |
| Standard Deviation (Sample) | 10.3% | 5.8% |
| Standard Deviation (Population) | 10.1% | 5.8% |
Similar Demographics by In Labor Force | Age > 16
Demographics Similar to Immigrants from Southern Europe by In Labor Force | Age > 16
In terms of in labor force | age > 16, the demographic groups most similar to Immigrants from Southern Europe are Romanian (65.0%, a difference of 0.0%), Haitian (65.0%, a difference of 0.010%), Barbadian (65.0%, a difference of 0.030%), Scandinavian (65.0%, a difference of 0.030%), and Immigrants from Fiji (65.0%, a difference of 0.030%).
| Demographics | Rating | Rank | In Labor Force | Age > 16 |
| Immigrants | Croatia | 35.7 /100 | #187 | Fair 65.0% |
| Immigrants | Portugal | 34.8 /100 | #188 | Fair 65.0% |
| Immigrants | Greece | 34.3 /100 | #189 | Fair 65.0% |
| Barbadians | 33.9 /100 | #190 | Fair 65.0% |
| Scandinavians | 33.7 /100 | #191 | Fair 65.0% |
| Immigrants | Fiji | 33.7 /100 | #192 | Fair 65.0% |
| Immigrants | Europe | 33.6 /100 | #193 | Fair 65.0% |
| Immigrants | Southern Europe | 31.3 /100 | #194 | Fair 65.0% |
| Romanians | 31.1 /100 | #195 | Fair 65.0% |
| Haitians | 30.6 /100 | #196 | Fair 65.0% |
| Immigrants | Italy | 28.7 /100 | #197 | Fair 65.0% |
| Greeks | 26.1 /100 | #198 | Fair 64.9% |
| Mexican American Indians | 23.1 /100 | #199 | Fair 64.9% |
| Armenians | 20.2 /100 | #200 | Fair 64.9% |
| Ukrainians | 19.6 /100 | #201 | Poor 64.9% |
Demographics Similar to Immigrants from Peru by In Labor Force | Age > 16
In terms of in labor force | age > 16, the demographic groups most similar to Immigrants from Peru are Immigrants from Burma/Myanmar (66.3%, a difference of 0.0%), Indonesian (66.3%, a difference of 0.0%), Immigrants from Turkey (66.3%, a difference of 0.020%), Venezuelan (66.3%, a difference of 0.040%), and Peruvian (66.3%, a difference of 0.040%).
| Demographics | Rating | Rank | In Labor Force | Age > 16 |
| Immigrants | Sri Lanka | 99.9 /100 | #53 | Exceptional 66.5% |
| Immigrants | Bosnia and Herzegovina | 99.9 /100 | #54 | Exceptional 66.5% |
| Immigrants | Venezuela | 99.9 /100 | #55 | Exceptional 66.4% |
| Immigrants | Senegal | 99.9 /100 | #56 | Exceptional 66.4% |
| Bulgarians | 99.9 /100 | #57 | Exceptional 66.4% |
| Immigrants | Saudi Arabia | 99.9 /100 | #58 | Exceptional 66.3% |
| Immigrants | Turkey | 99.9 /100 | #59 | Exceptional 66.3% |
| Immigrants | Peru | 99.8 /100 | #60 | Exceptional 66.3% |
| Immigrants | Burma/Myanmar | 99.8 /100 | #61 | Exceptional 66.3% |
| Indonesians | 99.8 /100 | #62 | Exceptional 66.3% |
| Venezuelans | 99.8 /100 | #63 | Exceptional 66.3% |
| Peruvians | 99.8 /100 | #64 | Exceptional 66.3% |
| Sri Lankans | 99.8 /100 | #65 | Exceptional 66.3% |
| Jordanians | 99.8 /100 | #66 | Exceptional 66.3% |
| Egyptians | 99.8 /100 | #67 | Exceptional 66.2% |