Immigrants from Jordan vs Latvian In Labor Force | Age 25-29
COMPARE
Immigrants from Jordan
Latvian
In Labor Force | Age 25-29
In Labor Force | Age 25-29 Comparison
Immigrants from Jordan
Latvians
84.4%
IN LABOR FORCE | AGE 25-29
12.8/ 100
METRIC RATING
209th/ 347
METRIC RANK
86.1%
IN LABOR FORCE | AGE 25-29
100.0/ 100
METRIC RATING
14th/ 347
METRIC RANK
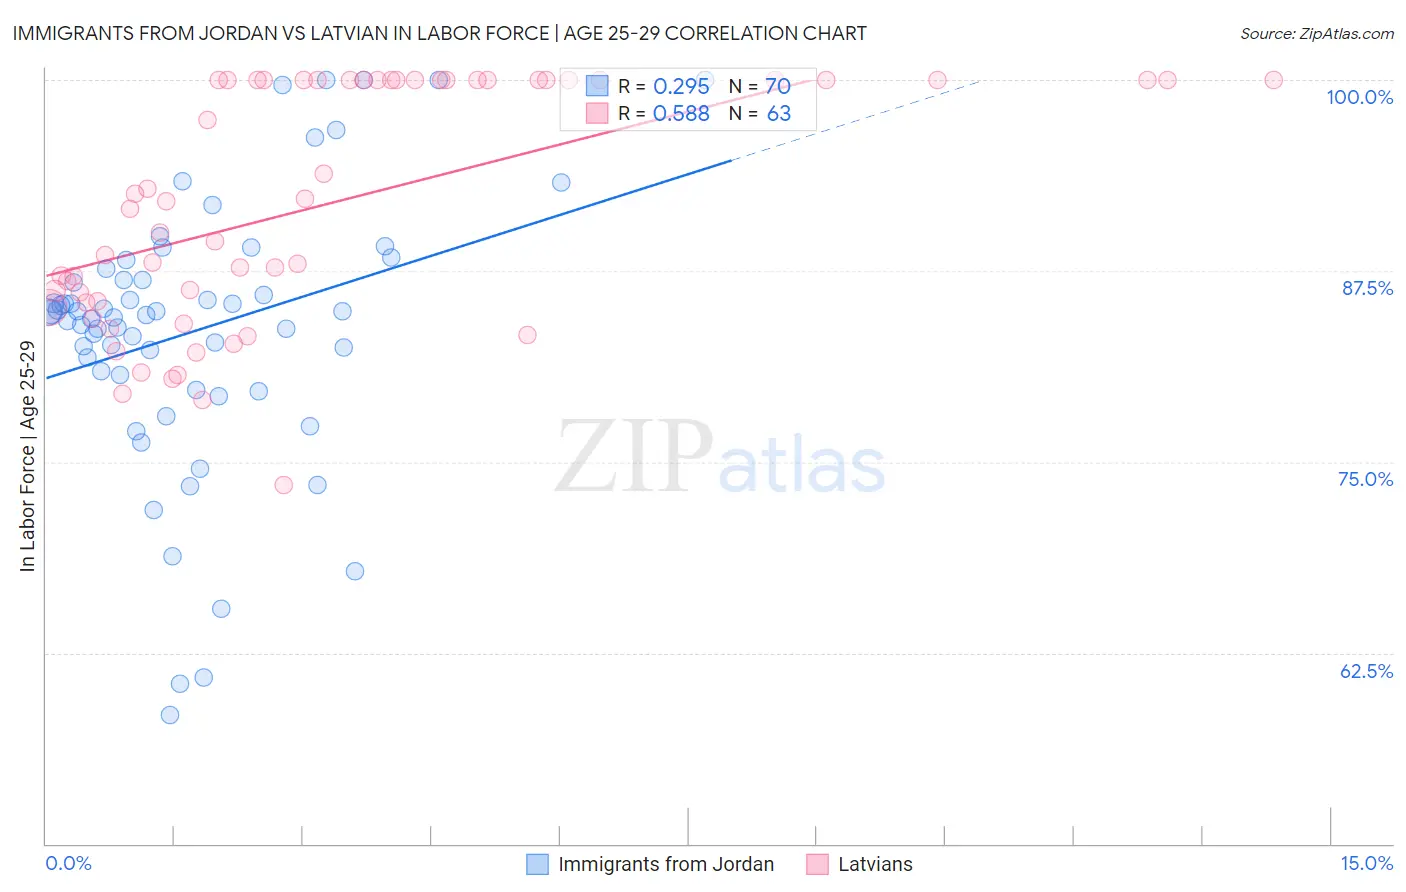
Immigrants from Jordan vs Latvian In Labor Force | Age 25-29 Correlation Chart
The statistical analysis conducted on geographies consisting of 181,276,232 people shows a weak positive correlation between the proportion of Immigrants from Jordan and labor force participation rate among population between the ages 25 and 29 in the United States with a correlation coefficient (R) of 0.295 and weighted average of 84.4%. Similarly, the statistical analysis conducted on geographies consisting of 220,680,234 people shows a substantial positive correlation between the proportion of Latvians and labor force participation rate among population between the ages 25 and 29 in the United States with a correlation coefficient (R) of 0.588 and weighted average of 86.1%, a difference of 2.1%.
In Labor Force | Age 25-29 Correlation Summary
| Measurement | Immigrants from Jordan | Latvian |
| Minimum | 58.5% | 73.5% |
| Maximum | 100.0% | 100.0% |
| Range | 41.5% | 26.5% |
| Mean | 83.6% | 91.9% |
| Median | 84.7% | 92.0% |
| Interquartile 25% (IQ1) | 80.7% | 85.4% |
| Interquartile 75% (IQ3) | 86.9% | 100.0% |
| Interquartile Range (IQR) | 6.2% | 14.6% |
| Standard Deviation (Sample) | 8.8% | 7.8% |
| Standard Deviation (Population) | 8.7% | 7.7% |
Similar Demographics by In Labor Force | Age 25-29
Demographics Similar to Immigrants from Jordan by In Labor Force | Age 25-29
In terms of in labor force | age 25-29, the demographic groups most similar to Immigrants from Jordan are Chinese (84.3%, a difference of 0.0%), Immigrants from Venezuela (84.3%, a difference of 0.0%), Immigrants from Armenia (84.4%, a difference of 0.010%), Immigrants from Indonesia (84.4%, a difference of 0.010%), and Immigrants from Cambodia (84.4%, a difference of 0.020%).
| Demographics | Rating | Rank | In Labor Force | Age 25-29 |
| Afghans | 15.9 /100 | #202 | Poor 84.4% |
| Immigrants | Afghanistan | 15.6 /100 | #203 | Poor 84.4% |
| Venezuelans | 15.1 /100 | #204 | Poor 84.4% |
| Ecuadorians | 14.8 /100 | #205 | Poor 84.4% |
| Immigrants | Cambodia | 14.3 /100 | #206 | Poor 84.4% |
| Immigrants | Armenia | 13.3 /100 | #207 | Poor 84.4% |
| Immigrants | Indonesia | 13.2 /100 | #208 | Poor 84.4% |
| Immigrants | Jordan | 12.8 /100 | #209 | Poor 84.4% |
| Chinese | 12.7 /100 | #210 | Poor 84.3% |
| Immigrants | Venezuela | 12.6 /100 | #211 | Poor 84.3% |
| Sub-Saharan Africans | 11.7 /100 | #212 | Poor 84.3% |
| Japanese | 11.4 /100 | #213 | Poor 84.3% |
| Lebanese | 11.1 /100 | #214 | Poor 84.3% |
| Immigrants | Syria | 10.7 /100 | #215 | Poor 84.3% |
| Israelis | 9.3 /100 | #216 | Tragic 84.3% |
Demographics Similar to Latvians by In Labor Force | Age 25-29
In terms of in labor force | age 25-29, the demographic groups most similar to Latvians are Bolivian (86.1%, a difference of 0.0%), Immigrants from Bolivia (86.1%, a difference of 0.010%), Norwegian (86.1%, a difference of 0.030%), Immigrants from Lithuania (86.1%, a difference of 0.040%), and Immigrants from Ethiopia (86.1%, a difference of 0.050%).
| Demographics | Rating | Rank | In Labor Force | Age 25-29 |
| Immigrants | Bosnia and Herzegovina | 100.0 /100 | #7 | Exceptional 86.3% |
| Immigrants | Cabo Verde | 100.0 /100 | #8 | Exceptional 86.2% |
| Ethiopians | 100.0 /100 | #9 | Exceptional 86.2% |
| Liberians | 100.0 /100 | #10 | Exceptional 86.1% |
| Immigrants | Ethiopia | 100.0 /100 | #11 | Exceptional 86.1% |
| Immigrants | Lithuania | 100.0 /100 | #12 | Exceptional 86.1% |
| Norwegians | 100.0 /100 | #13 | Exceptional 86.1% |
| Latvians | 100.0 /100 | #14 | Exceptional 86.1% |
| Bolivians | 100.0 /100 | #15 | Exceptional 86.1% |
| Immigrants | Bolivia | 100.0 /100 | #16 | Exceptional 86.1% |
| Bermudans | 100.0 /100 | #17 | Exceptional 86.0% |
| Bulgarians | 100.0 /100 | #18 | Exceptional 86.0% |
| Cape Verdeans | 100.0 /100 | #19 | Exceptional 86.0% |
| Immigrants | Ireland | 100.0 /100 | #20 | Exceptional 86.0% |
| Maltese | 100.0 /100 | #21 | Exceptional 86.0% |