Immigrants from Jordan vs Egyptian In Labor Force | Age 25-29
COMPARE
Immigrants from Jordan
Egyptian
In Labor Force | Age 25-29
In Labor Force | Age 25-29 Comparison
Immigrants from Jordan
Egyptians
84.4%
IN LABOR FORCE | AGE 25-29
12.8/ 100
METRIC RATING
209th/ 347
METRIC RANK
85.1%
IN LABOR FORCE | AGE 25-29
93.8/ 100
METRIC RATING
101st/ 347
METRIC RANK
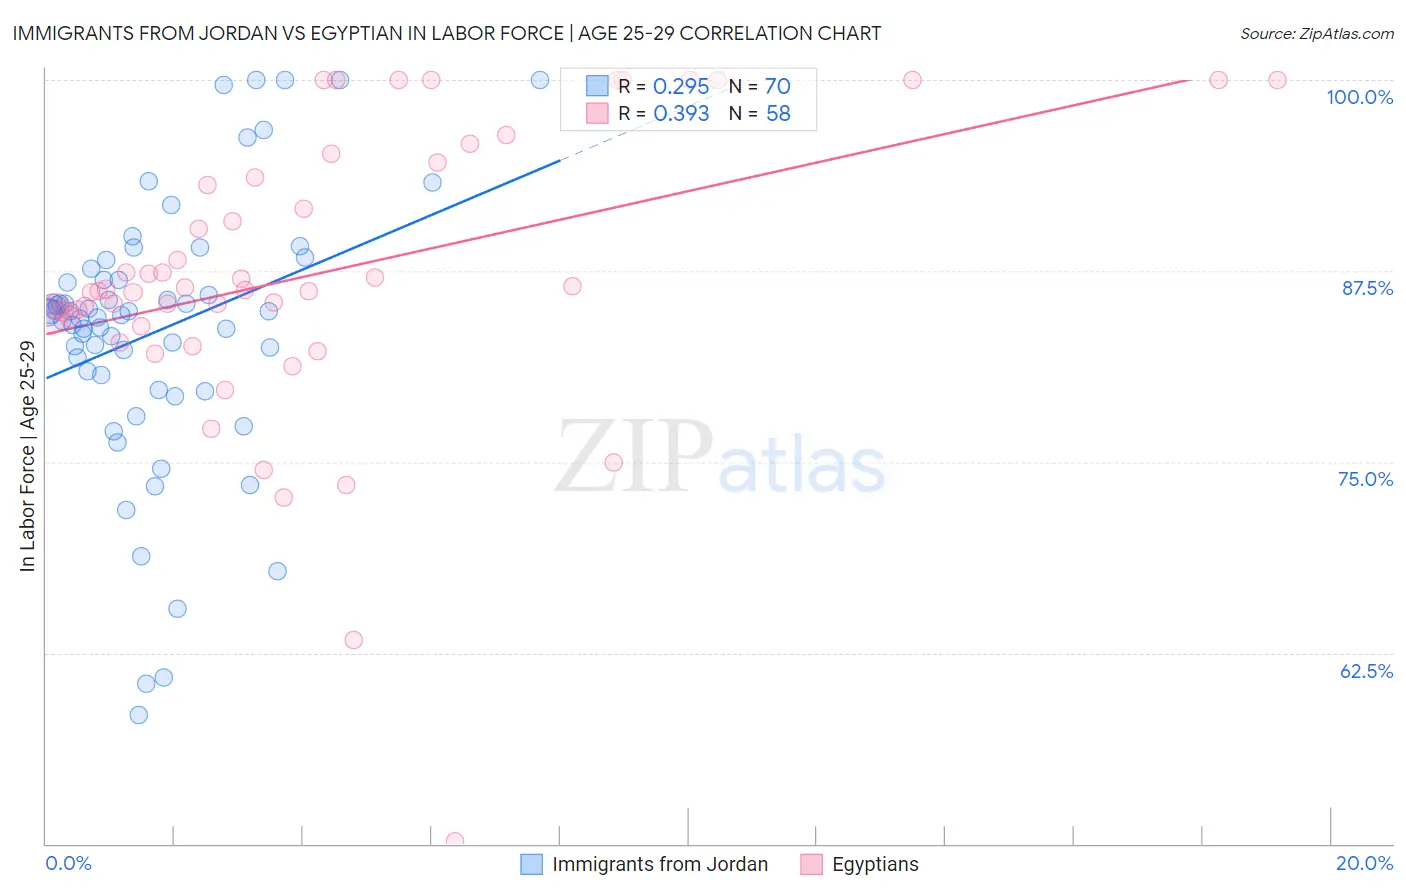
Immigrants from Jordan vs Egyptian In Labor Force | Age 25-29 Correlation Chart
The statistical analysis conducted on geographies consisting of 181,276,232 people shows a weak positive correlation between the proportion of Immigrants from Jordan and labor force participation rate among population between the ages 25 and 29 in the United States with a correlation coefficient (R) of 0.295 and weighted average of 84.4%. Similarly, the statistical analysis conducted on geographies consisting of 276,865,040 people shows a mild positive correlation between the proportion of Egyptians and labor force participation rate among population between the ages 25 and 29 in the United States with a correlation coefficient (R) of 0.393 and weighted average of 85.1%, a difference of 0.86%.
In Labor Force | Age 25-29 Correlation Summary
| Measurement | Immigrants from Jordan | Egyptian |
| Minimum | 58.5% | 50.2% |
| Maximum | 100.0% | 100.0% |
| Range | 41.5% | 49.8% |
| Mean | 83.6% | 87.4% |
| Median | 84.7% | 86.3% |
| Interquartile 25% (IQ1) | 80.7% | 84.5% |
| Interquartile 75% (IQ3) | 86.9% | 94.6% |
| Interquartile Range (IQR) | 6.2% | 10.1% |
| Standard Deviation (Sample) | 8.8% | 9.5% |
| Standard Deviation (Population) | 8.7% | 9.5% |
Similar Demographics by In Labor Force | Age 25-29
Demographics Similar to Immigrants from Jordan by In Labor Force | Age 25-29
In terms of in labor force | age 25-29, the demographic groups most similar to Immigrants from Jordan are Chinese (84.3%, a difference of 0.0%), Immigrants from Venezuela (84.3%, a difference of 0.0%), Immigrants from Armenia (84.4%, a difference of 0.010%), Immigrants from Indonesia (84.4%, a difference of 0.010%), and Immigrants from Cambodia (84.4%, a difference of 0.020%).
| Demographics | Rating | Rank | In Labor Force | Age 25-29 |
| Afghans | 15.9 /100 | #202 | Poor 84.4% |
| Immigrants | Afghanistan | 15.6 /100 | #203 | Poor 84.4% |
| Venezuelans | 15.1 /100 | #204 | Poor 84.4% |
| Ecuadorians | 14.8 /100 | #205 | Poor 84.4% |
| Immigrants | Cambodia | 14.3 /100 | #206 | Poor 84.4% |
| Immigrants | Armenia | 13.3 /100 | #207 | Poor 84.4% |
| Immigrants | Indonesia | 13.2 /100 | #208 | Poor 84.4% |
| Immigrants | Jordan | 12.8 /100 | #209 | Poor 84.4% |
| Chinese | 12.7 /100 | #210 | Poor 84.3% |
| Immigrants | Venezuela | 12.6 /100 | #211 | Poor 84.3% |
| Sub-Saharan Africans | 11.7 /100 | #212 | Poor 84.3% |
| Japanese | 11.4 /100 | #213 | Poor 84.3% |
| Lebanese | 11.1 /100 | #214 | Poor 84.3% |
| Immigrants | Syria | 10.7 /100 | #215 | Poor 84.3% |
| Israelis | 9.3 /100 | #216 | Tragic 84.3% |
Demographics Similar to Egyptians by In Labor Force | Age 25-29
In terms of in labor force | age 25-29, the demographic groups most similar to Egyptians are Immigrants from Switzerland (85.1%, a difference of 0.0%), Slavic (85.1%, a difference of 0.0%), Mongolian (85.1%, a difference of 0.010%), Bangladeshi (85.1%, a difference of 0.010%), and Immigrants from Japan (85.1%, a difference of 0.010%).
| Demographics | Rating | Rank | In Labor Force | Age 25-29 |
| Immigrants | Korea | 94.8 /100 | #94 | Exceptional 85.1% |
| Immigrants | Netherlands | 94.6 /100 | #95 | Exceptional 85.1% |
| Immigrants | Romania | 94.6 /100 | #96 | Exceptional 85.1% |
| Immigrants | Sudan | 94.3 /100 | #97 | Exceptional 85.1% |
| Mongolians | 94.1 /100 | #98 | Exceptional 85.1% |
| Bangladeshis | 94.0 /100 | #99 | Exceptional 85.1% |
| Immigrants | Switzerland | 93.9 /100 | #100 | Exceptional 85.1% |
| Egyptians | 93.8 /100 | #101 | Exceptional 85.1% |
| Slavs | 93.7 /100 | #102 | Exceptional 85.1% |
| Immigrants | Japan | 93.5 /100 | #103 | Exceptional 85.1% |
| Immigrants | Zaire | 93.3 /100 | #104 | Exceptional 85.1% |
| Immigrants | Hong Kong | 92.8 /100 | #105 | Exceptional 85.0% |
| Czechoslovakians | 92.6 /100 | #106 | Exceptional 85.0% |
| Immigrants | Southern Europe | 92.3 /100 | #107 | Exceptional 85.0% |
| Immigrants | Austria | 91.9 /100 | #108 | Exceptional 85.0% |