French American Indian vs Latvian In Labor Force | Age 25-29
COMPARE
French American Indian
Latvian
In Labor Force | Age 25-29
In Labor Force | Age 25-29 Comparison
French American Indians
Latvians
84.2%
IN LABOR FORCE | AGE 25-29
5.5/ 100
METRIC RATING
227th/ 347
METRIC RANK
86.1%
IN LABOR FORCE | AGE 25-29
100.0/ 100
METRIC RATING
14th/ 347
METRIC RANK
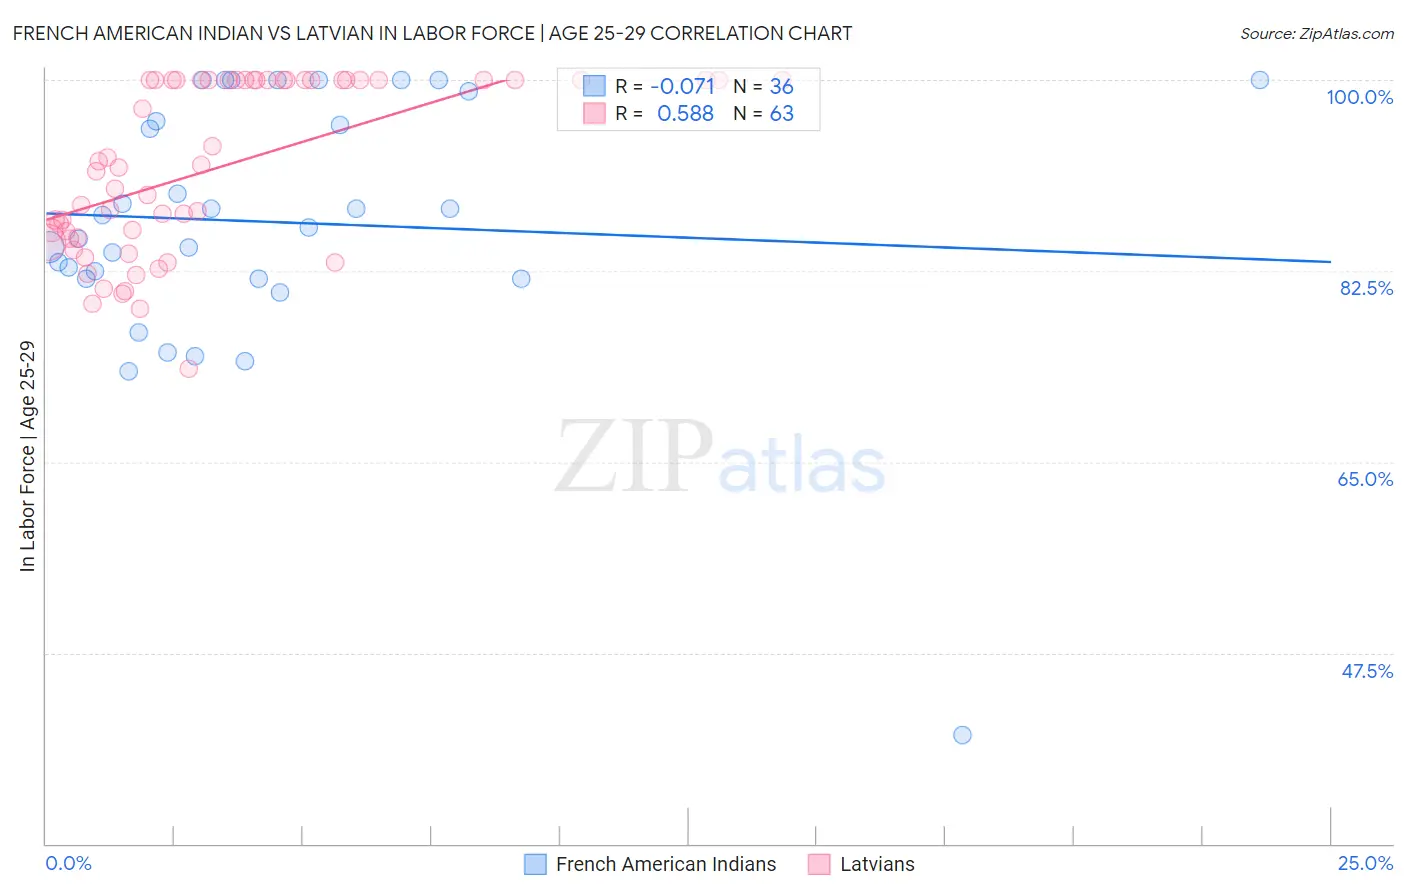
French American Indian vs Latvian In Labor Force | Age 25-29 Correlation Chart
The statistical analysis conducted on geographies consisting of 131,957,591 people shows a slight negative correlation between the proportion of French American Indians and labor force participation rate among population between the ages 25 and 29 in the United States with a correlation coefficient (R) of -0.071 and weighted average of 84.2%. Similarly, the statistical analysis conducted on geographies consisting of 220,680,234 people shows a substantial positive correlation between the proportion of Latvians and labor force participation rate among population between the ages 25 and 29 in the United States with a correlation coefficient (R) of 0.588 and weighted average of 86.1%, a difference of 2.2%.
In Labor Force | Age 25-29 Correlation Summary
| Measurement | French American Indian | Latvian |
| Minimum | 40.0% | 73.5% |
| Maximum | 100.0% | 100.0% |
| Range | 60.0% | 26.5% |
| Mean | 87.0% | 91.9% |
| Median | 87.1% | 92.0% |
| Interquartile 25% (IQ1) | 81.8% | 85.4% |
| Interquartile 75% (IQ3) | 97.6% | 100.0% |
| Interquartile Range (IQR) | 15.8% | 14.6% |
| Standard Deviation (Sample) | 11.8% | 7.8% |
| Standard Deviation (Population) | 11.7% | 7.7% |
Similar Demographics by In Labor Force | Age 25-29
Demographics Similar to French American Indians by In Labor Force | Age 25-29
In terms of in labor force | age 25-29, the demographic groups most similar to French American Indians are Immigrants from Panama (84.2%, a difference of 0.0%), Korean (84.2%, a difference of 0.010%), Immigrants from Congo (84.2%, a difference of 0.010%), Immigrants from West Indies (84.2%, a difference of 0.020%), and Immigrants from Oceania (84.2%, a difference of 0.020%).
| Demographics | Rating | Rank | In Labor Force | Age 25-29 |
| Nigerians | 7.2 /100 | #220 | Tragic 84.3% |
| Arabs | 6.8 /100 | #221 | Tragic 84.2% |
| Jordanians | 6.7 /100 | #222 | Tragic 84.2% |
| Scotch-Irish | 6.5 /100 | #223 | Tragic 84.2% |
| Immigrants | West Indies | 6.0 /100 | #224 | Tragic 84.2% |
| Koreans | 5.9 /100 | #225 | Tragic 84.2% |
| Immigrants | Congo | 5.8 /100 | #226 | Tragic 84.2% |
| French American Indians | 5.5 /100 | #227 | Tragic 84.2% |
| Immigrants | Panama | 5.5 /100 | #228 | Tragic 84.2% |
| Immigrants | Oceania | 5.0 /100 | #229 | Tragic 84.2% |
| Whites/Caucasians | 4.8 /100 | #230 | Tragic 84.2% |
| Immigrants | Philippines | 4.7 /100 | #231 | Tragic 84.2% |
| Panamanians | 4.5 /100 | #232 | Tragic 84.2% |
| Immigrants | Western Asia | 2.7 /100 | #233 | Tragic 84.1% |
| Barbadians | 1.0 /100 | #234 | Tragic 83.9% |
Demographics Similar to Latvians by In Labor Force | Age 25-29
In terms of in labor force | age 25-29, the demographic groups most similar to Latvians are Bolivian (86.1%, a difference of 0.0%), Immigrants from Bolivia (86.1%, a difference of 0.010%), Norwegian (86.1%, a difference of 0.030%), Immigrants from Lithuania (86.1%, a difference of 0.040%), and Immigrants from Ethiopia (86.1%, a difference of 0.050%).
| Demographics | Rating | Rank | In Labor Force | Age 25-29 |
| Immigrants | Bosnia and Herzegovina | 100.0 /100 | #7 | Exceptional 86.3% |
| Immigrants | Cabo Verde | 100.0 /100 | #8 | Exceptional 86.2% |
| Ethiopians | 100.0 /100 | #9 | Exceptional 86.2% |
| Liberians | 100.0 /100 | #10 | Exceptional 86.1% |
| Immigrants | Ethiopia | 100.0 /100 | #11 | Exceptional 86.1% |
| Immigrants | Lithuania | 100.0 /100 | #12 | Exceptional 86.1% |
| Norwegians | 100.0 /100 | #13 | Exceptional 86.1% |
| Latvians | 100.0 /100 | #14 | Exceptional 86.1% |
| Bolivians | 100.0 /100 | #15 | Exceptional 86.1% |
| Immigrants | Bolivia | 100.0 /100 | #16 | Exceptional 86.1% |
| Bermudans | 100.0 /100 | #17 | Exceptional 86.0% |
| Bulgarians | 100.0 /100 | #18 | Exceptional 86.0% |
| Cape Verdeans | 100.0 /100 | #19 | Exceptional 86.0% |
| Immigrants | Ireland | 100.0 /100 | #20 | Exceptional 86.0% |
| Maltese | 100.0 /100 | #21 | Exceptional 86.0% |