Immigrants from Jordan vs Immigrants from Sierra Leone In Labor Force | Age 25-29
COMPARE
Immigrants from Jordan
Immigrants from Sierra Leone
In Labor Force | Age 25-29
In Labor Force | Age 25-29 Comparison
Immigrants from Jordan
Immigrants from Sierra Leone
84.4%
IN LABOR FORCE | AGE 25-29
12.8/ 100
METRIC RATING
209th/ 347
METRIC RANK
85.7%
IN LABOR FORCE | AGE 25-29
99.9/ 100
METRIC RATING
45th/ 347
METRIC RANK
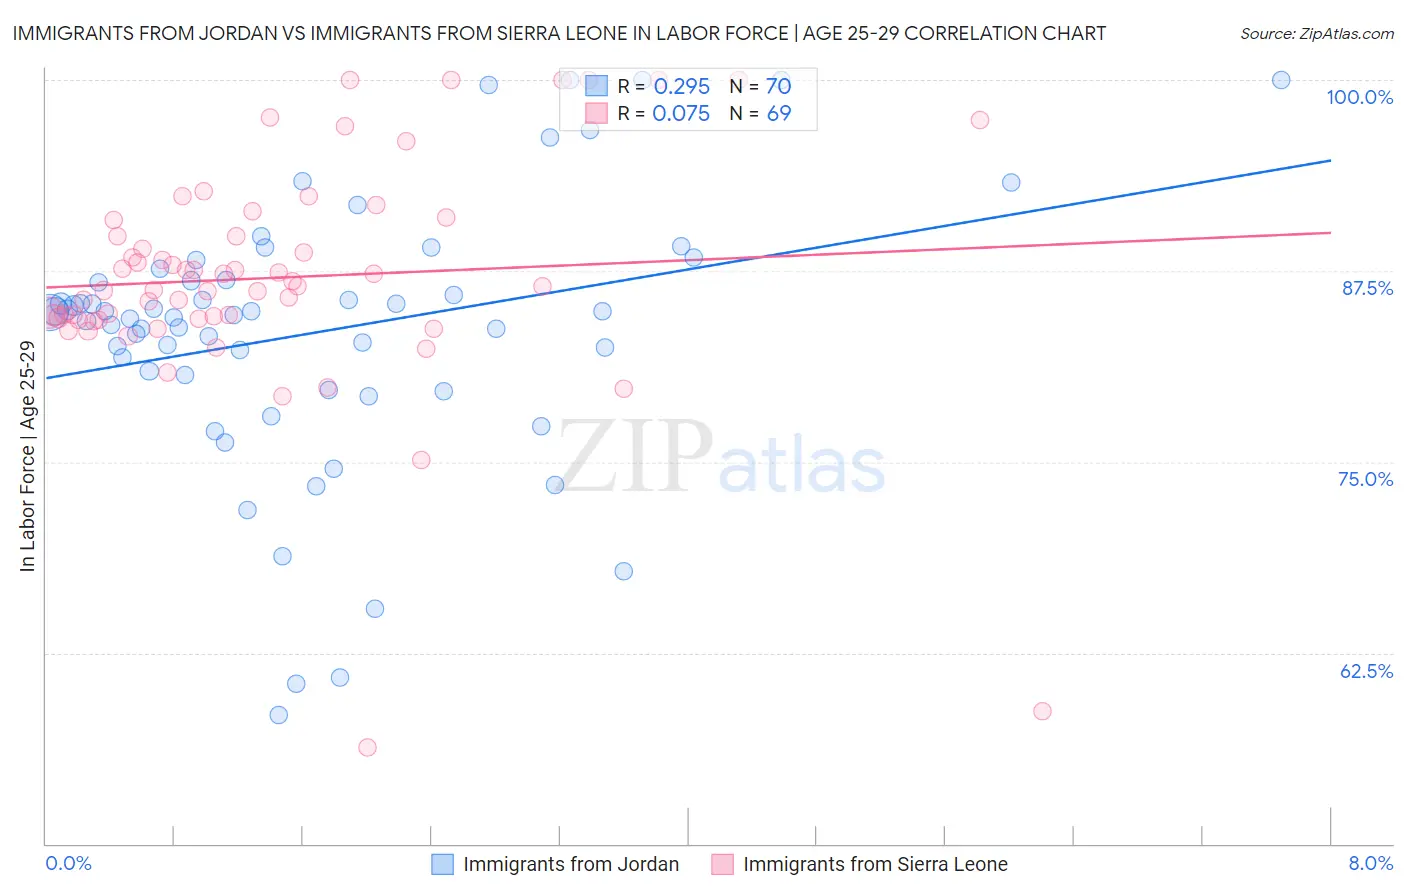
Immigrants from Jordan vs Immigrants from Sierra Leone In Labor Force | Age 25-29 Correlation Chart
The statistical analysis conducted on geographies consisting of 181,276,232 people shows a weak positive correlation between the proportion of Immigrants from Jordan and labor force participation rate among population between the ages 25 and 29 in the United States with a correlation coefficient (R) of 0.295 and weighted average of 84.4%. Similarly, the statistical analysis conducted on geographies consisting of 101,649,226 people shows a slight positive correlation between the proportion of Immigrants from Sierra Leone and labor force participation rate among population between the ages 25 and 29 in the United States with a correlation coefficient (R) of 0.075 and weighted average of 85.7%, a difference of 1.6%.
In Labor Force | Age 25-29 Correlation Summary
| Measurement | Immigrants from Jordan | Immigrants from Sierra Leone |
| Minimum | 58.5% | 56.3% |
| Maximum | 100.0% | 100.0% |
| Range | 41.5% | 43.7% |
| Mean | 83.6% | 87.1% |
| Median | 84.7% | 86.5% |
| Interquartile 25% (IQ1) | 80.7% | 84.4% |
| Interquartile 75% (IQ3) | 86.9% | 90.3% |
| Interquartile Range (IQR) | 6.2% | 6.0% |
| Standard Deviation (Sample) | 8.8% | 7.6% |
| Standard Deviation (Population) | 8.7% | 7.5% |
Similar Demographics by In Labor Force | Age 25-29
Demographics Similar to Immigrants from Jordan by In Labor Force | Age 25-29
In terms of in labor force | age 25-29, the demographic groups most similar to Immigrants from Jordan are Chinese (84.3%, a difference of 0.0%), Immigrants from Venezuela (84.3%, a difference of 0.0%), Immigrants from Armenia (84.4%, a difference of 0.010%), Immigrants from Indonesia (84.4%, a difference of 0.010%), and Immigrants from Cambodia (84.4%, a difference of 0.020%).
| Demographics | Rating | Rank | In Labor Force | Age 25-29 |
| Afghans | 15.9 /100 | #202 | Poor 84.4% |
| Immigrants | Afghanistan | 15.6 /100 | #203 | Poor 84.4% |
| Venezuelans | 15.1 /100 | #204 | Poor 84.4% |
| Ecuadorians | 14.8 /100 | #205 | Poor 84.4% |
| Immigrants | Cambodia | 14.3 /100 | #206 | Poor 84.4% |
| Immigrants | Armenia | 13.3 /100 | #207 | Poor 84.4% |
| Immigrants | Indonesia | 13.2 /100 | #208 | Poor 84.4% |
| Immigrants | Jordan | 12.8 /100 | #209 | Poor 84.4% |
| Chinese | 12.7 /100 | #210 | Poor 84.3% |
| Immigrants | Venezuela | 12.6 /100 | #211 | Poor 84.3% |
| Sub-Saharan Africans | 11.7 /100 | #212 | Poor 84.3% |
| Japanese | 11.4 /100 | #213 | Poor 84.3% |
| Lebanese | 11.1 /100 | #214 | Poor 84.3% |
| Immigrants | Syria | 10.7 /100 | #215 | Poor 84.3% |
| Israelis | 9.3 /100 | #216 | Tragic 84.3% |
Demographics Similar to Immigrants from Sierra Leone by In Labor Force | Age 25-29
In terms of in labor force | age 25-29, the demographic groups most similar to Immigrants from Sierra Leone are Macedonian (85.7%, a difference of 0.0%), Immigrants from India (85.7%, a difference of 0.010%), Immigrants from Eritrea (85.7%, a difference of 0.020%), Czech (85.6%, a difference of 0.030%), and Immigrants from Greece (85.7%, a difference of 0.060%).
| Demographics | Rating | Rank | In Labor Force | Age 25-29 |
| Sierra Leoneans | 99.9 /100 | #38 | Exceptional 85.8% |
| Croatians | 99.9 /100 | #39 | Exceptional 85.8% |
| Immigrants | Albania | 99.9 /100 | #40 | Exceptional 85.7% |
| Immigrants | Greece | 99.9 /100 | #41 | Exceptional 85.7% |
| Immigrants | Eritrea | 99.9 /100 | #42 | Exceptional 85.7% |
| Immigrants | India | 99.9 /100 | #43 | Exceptional 85.7% |
| Macedonians | 99.9 /100 | #44 | Exceptional 85.7% |
| Immigrants | Sierra Leone | 99.9 /100 | #45 | Exceptional 85.7% |
| Czechs | 99.8 /100 | #46 | Exceptional 85.6% |
| Turks | 99.8 /100 | #47 | Exceptional 85.6% |
| Italians | 99.8 /100 | #48 | Exceptional 85.6% |
| Swedes | 99.8 /100 | #49 | Exceptional 85.6% |
| Yugoslavians | 99.8 /100 | #50 | Exceptional 85.6% |
| Immigrants | Latvia | 99.8 /100 | #51 | Exceptional 85.6% |
| Immigrants | Poland | 99.7 /100 | #52 | Exceptional 85.6% |