Immigrants from Egypt vs Latvian In Labor Force | Age 25-29
COMPARE
Immigrants from Egypt
Latvian
In Labor Force | Age 25-29
In Labor Force | Age 25-29 Comparison
Immigrants from Egypt
Latvians
85.2%
IN LABOR FORCE | AGE 25-29
97.7/ 100
METRIC RATING
78th/ 347
METRIC RANK
86.1%
IN LABOR FORCE | AGE 25-29
100.0/ 100
METRIC RATING
14th/ 347
METRIC RANK
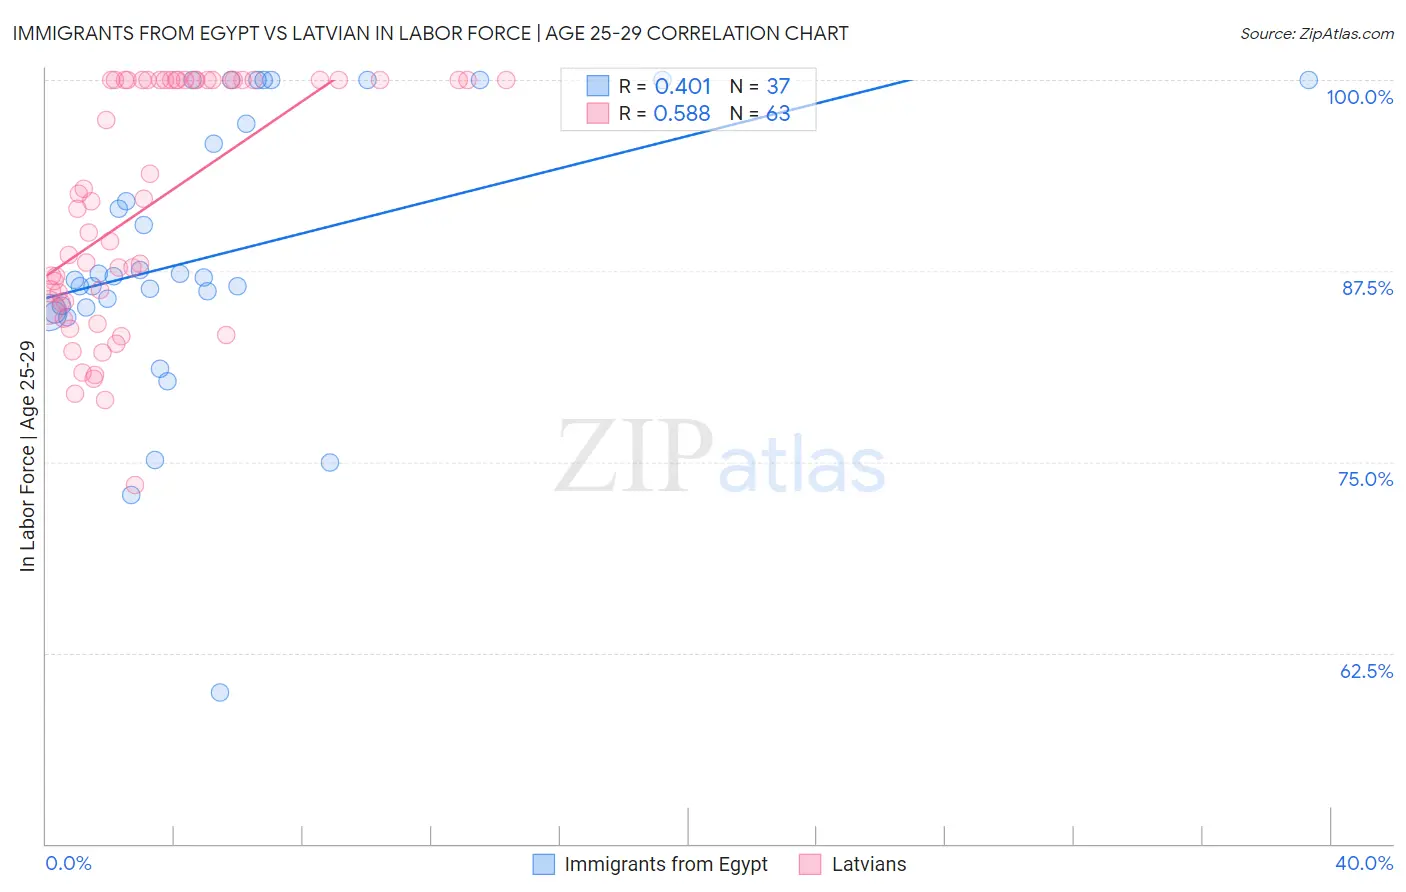
Immigrants from Egypt vs Latvian In Labor Force | Age 25-29 Correlation Chart
The statistical analysis conducted on geographies consisting of 245,441,194 people shows a moderate positive correlation between the proportion of Immigrants from Egypt and labor force participation rate among population between the ages 25 and 29 in the United States with a correlation coefficient (R) of 0.401 and weighted average of 85.2%. Similarly, the statistical analysis conducted on geographies consisting of 220,680,234 people shows a substantial positive correlation between the proportion of Latvians and labor force participation rate among population between the ages 25 and 29 in the United States with a correlation coefficient (R) of 0.588 and weighted average of 86.1%, a difference of 1.0%.
In Labor Force | Age 25-29 Correlation Summary
| Measurement | Immigrants from Egypt | Latvian |
| Minimum | 59.9% | 73.5% |
| Maximum | 100.0% | 100.0% |
| Range | 40.1% | 26.5% |
| Mean | 88.6% | 91.9% |
| Median | 87.1% | 92.0% |
| Interquartile 25% (IQ1) | 85.0% | 85.4% |
| Interquartile 75% (IQ3) | 98.6% | 100.0% |
| Interquartile Range (IQR) | 13.6% | 14.6% |
| Standard Deviation (Sample) | 9.1% | 7.8% |
| Standard Deviation (Population) | 9.0% | 7.7% |
Similar Demographics by In Labor Force | Age 25-29
Demographics Similar to Immigrants from Egypt by In Labor Force | Age 25-29
In terms of in labor force | age 25-29, the demographic groups most similar to Immigrants from Egypt are Immigrants from Northern Africa (85.2%, a difference of 0.010%), Immigrants from Zimbabwe (85.2%, a difference of 0.010%), Immigrants from South Central Asia (85.2%, a difference of 0.020%), German (85.3%, a difference of 0.030%), and Immigrants from Northern Europe (85.2%, a difference of 0.030%).
| Demographics | Rating | Rank | In Labor Force | Age 25-29 |
| Kenyans | 99.0 /100 | #71 | Exceptional 85.4% |
| Immigrants | Australia | 98.9 /100 | #72 | Exceptional 85.3% |
| Russians | 98.8 /100 | #73 | Exceptional 85.3% |
| Soviet Union | 98.5 /100 | #74 | Exceptional 85.3% |
| Brazilians | 98.3 /100 | #75 | Exceptional 85.3% |
| Germans | 98.1 /100 | #76 | Exceptional 85.3% |
| Immigrants | South Central Asia | 97.9 /100 | #77 | Exceptional 85.2% |
| Immigrants | Egypt | 97.7 /100 | #78 | Exceptional 85.2% |
| Immigrants | Northern Africa | 97.6 /100 | #79 | Exceptional 85.2% |
| Immigrants | Zimbabwe | 97.6 /100 | #80 | Exceptional 85.2% |
| Immigrants | Northern Europe | 97.2 /100 | #81 | Exceptional 85.2% |
| Okinawans | 97.0 /100 | #82 | Exceptional 85.2% |
| Immigrants | Europe | 96.8 /100 | #83 | Exceptional 85.2% |
| Immigrants | Eastern Europe | 96.8 /100 | #84 | Exceptional 85.2% |
| Immigrants | Africa | 96.7 /100 | #85 | Exceptional 85.2% |
Demographics Similar to Latvians by In Labor Force | Age 25-29
In terms of in labor force | age 25-29, the demographic groups most similar to Latvians are Bolivian (86.1%, a difference of 0.0%), Immigrants from Bolivia (86.1%, a difference of 0.010%), Norwegian (86.1%, a difference of 0.030%), Immigrants from Lithuania (86.1%, a difference of 0.040%), and Immigrants from Ethiopia (86.1%, a difference of 0.050%).
| Demographics | Rating | Rank | In Labor Force | Age 25-29 |
| Immigrants | Bosnia and Herzegovina | 100.0 /100 | #7 | Exceptional 86.3% |
| Immigrants | Cabo Verde | 100.0 /100 | #8 | Exceptional 86.2% |
| Ethiopians | 100.0 /100 | #9 | Exceptional 86.2% |
| Liberians | 100.0 /100 | #10 | Exceptional 86.1% |
| Immigrants | Ethiopia | 100.0 /100 | #11 | Exceptional 86.1% |
| Immigrants | Lithuania | 100.0 /100 | #12 | Exceptional 86.1% |
| Norwegians | 100.0 /100 | #13 | Exceptional 86.1% |
| Latvians | 100.0 /100 | #14 | Exceptional 86.1% |
| Bolivians | 100.0 /100 | #15 | Exceptional 86.1% |
| Immigrants | Bolivia | 100.0 /100 | #16 | Exceptional 86.1% |
| Bermudans | 100.0 /100 | #17 | Exceptional 86.0% |
| Bulgarians | 100.0 /100 | #18 | Exceptional 86.0% |
| Cape Verdeans | 100.0 /100 | #19 | Exceptional 86.0% |
| Immigrants | Ireland | 100.0 /100 | #20 | Exceptional 86.0% |
| Maltese | 100.0 /100 | #21 | Exceptional 86.0% |