Immigrants from Jordan vs Mexican In Labor Force | Age 25-29
COMPARE
Immigrants from Jordan
Mexican
In Labor Force | Age 25-29
In Labor Force | Age 25-29 Comparison
Immigrants from Jordan
Mexicans
84.4%
IN LABOR FORCE | AGE 25-29
12.8/ 100
METRIC RATING
209th/ 347
METRIC RANK
81.9%
IN LABOR FORCE | AGE 25-29
0.0/ 100
METRIC RATING
316th/ 347
METRIC RANK
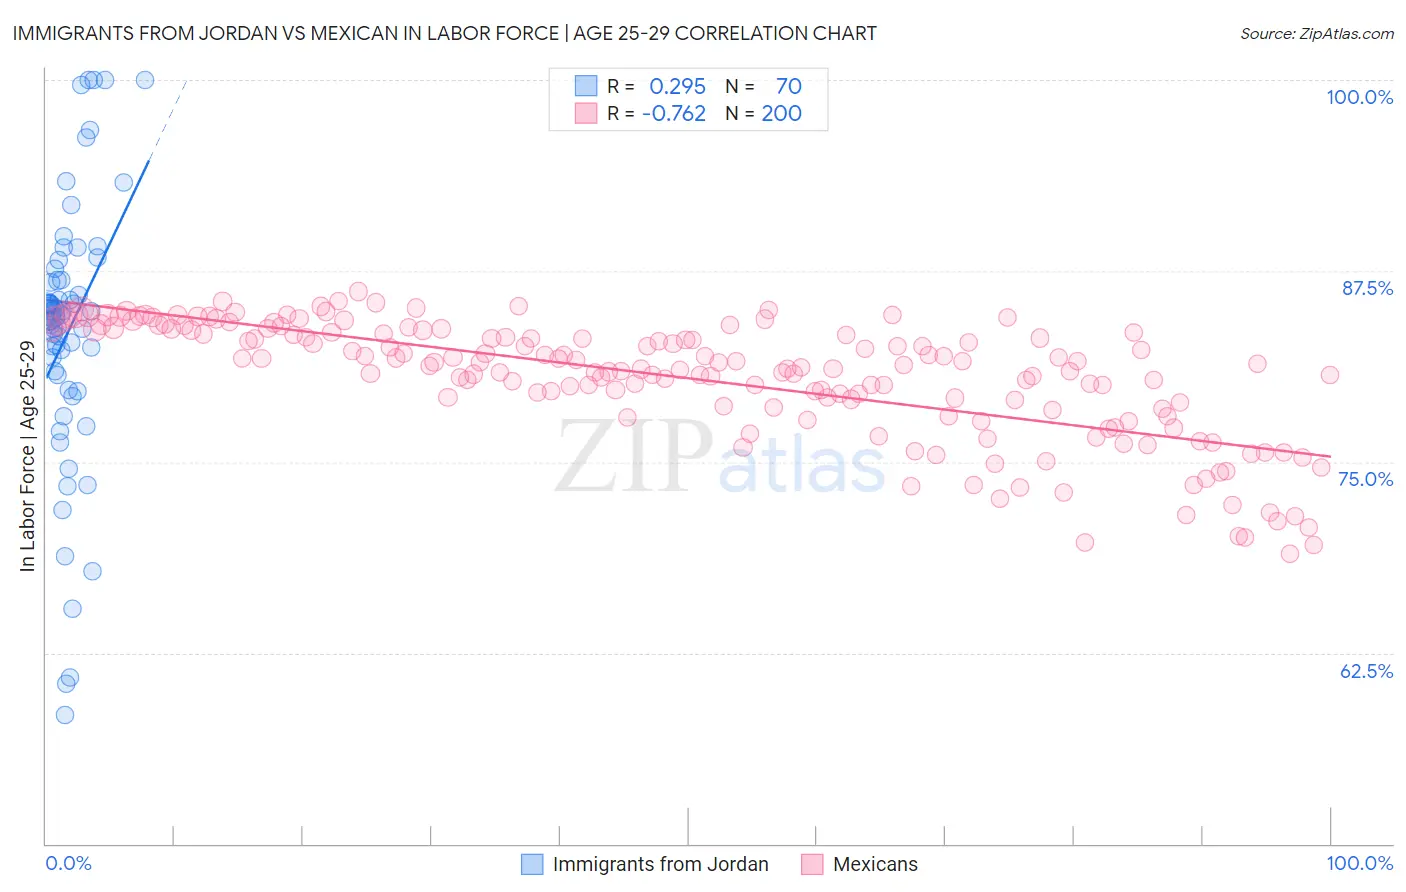
Immigrants from Jordan vs Mexican In Labor Force | Age 25-29 Correlation Chart
The statistical analysis conducted on geographies consisting of 181,276,232 people shows a weak positive correlation between the proportion of Immigrants from Jordan and labor force participation rate among population between the ages 25 and 29 in the United States with a correlation coefficient (R) of 0.295 and weighted average of 84.4%. Similarly, the statistical analysis conducted on geographies consisting of 564,184,194 people shows a strong negative correlation between the proportion of Mexicans and labor force participation rate among population between the ages 25 and 29 in the United States with a correlation coefficient (R) of -0.762 and weighted average of 81.9%, a difference of 2.9%.
In Labor Force | Age 25-29 Correlation Summary
| Measurement | Immigrants from Jordan | Mexican |
| Minimum | 58.5% | 69.0% |
| Maximum | 100.0% | 86.2% |
| Range | 41.5% | 17.2% |
| Mean | 83.6% | 80.5% |
| Median | 84.7% | 81.4% |
| Interquartile 25% (IQ1) | 80.7% | 78.6% |
| Interquartile 75% (IQ3) | 86.9% | 83.5% |
| Interquartile Range (IQR) | 6.2% | 4.9% |
| Standard Deviation (Sample) | 8.8% | 3.9% |
| Standard Deviation (Population) | 8.7% | 3.9% |
Similar Demographics by In Labor Force | Age 25-29
Demographics Similar to Immigrants from Jordan by In Labor Force | Age 25-29
In terms of in labor force | age 25-29, the demographic groups most similar to Immigrants from Jordan are Chinese (84.3%, a difference of 0.0%), Immigrants from Venezuela (84.3%, a difference of 0.0%), Immigrants from Armenia (84.4%, a difference of 0.010%), Immigrants from Indonesia (84.4%, a difference of 0.010%), and Immigrants from Cambodia (84.4%, a difference of 0.020%).
| Demographics | Rating | Rank | In Labor Force | Age 25-29 |
| Afghans | 15.9 /100 | #202 | Poor 84.4% |
| Immigrants | Afghanistan | 15.6 /100 | #203 | Poor 84.4% |
| Venezuelans | 15.1 /100 | #204 | Poor 84.4% |
| Ecuadorians | 14.8 /100 | #205 | Poor 84.4% |
| Immigrants | Cambodia | 14.3 /100 | #206 | Poor 84.4% |
| Immigrants | Armenia | 13.3 /100 | #207 | Poor 84.4% |
| Immigrants | Indonesia | 13.2 /100 | #208 | Poor 84.4% |
| Immigrants | Jordan | 12.8 /100 | #209 | Poor 84.4% |
| Chinese | 12.7 /100 | #210 | Poor 84.3% |
| Immigrants | Venezuela | 12.6 /100 | #211 | Poor 84.3% |
| Sub-Saharan Africans | 11.7 /100 | #212 | Poor 84.3% |
| Japanese | 11.4 /100 | #213 | Poor 84.3% |
| Lebanese | 11.1 /100 | #214 | Poor 84.3% |
| Immigrants | Syria | 10.7 /100 | #215 | Poor 84.3% |
| Israelis | 9.3 /100 | #216 | Tragic 84.3% |
Demographics Similar to Mexicans by In Labor Force | Age 25-29
In terms of in labor force | age 25-29, the demographic groups most similar to Mexicans are Chickasaw (81.9%, a difference of 0.070%), Immigrants from Mexico (82.0%, a difference of 0.090%), Comanche (81.9%, a difference of 0.090%), Cherokee (82.1%, a difference of 0.22%), and Yaqui (82.2%, a difference of 0.27%).
| Demographics | Rating | Rank | In Labor Force | Age 25-29 |
| Immigrants | Central America | 0.0 /100 | #309 | Tragic 82.4% |
| Osage | 0.0 /100 | #310 | Tragic 82.3% |
| Alaskan Athabascans | 0.0 /100 | #311 | Tragic 82.3% |
| Hispanics or Latinos | 0.0 /100 | #312 | Tragic 82.2% |
| Yaqui | 0.0 /100 | #313 | Tragic 82.2% |
| Cherokee | 0.0 /100 | #314 | Tragic 82.1% |
| Immigrants | Mexico | 0.0 /100 | #315 | Tragic 82.0% |
| Mexicans | 0.0 /100 | #316 | Tragic 81.9% |
| Chickasaw | 0.0 /100 | #317 | Tragic 81.9% |
| Comanche | 0.0 /100 | #318 | Tragic 81.9% |
| Seminole | 0.0 /100 | #319 | Tragic 81.7% |
| Colville | 0.0 /100 | #320 | Tragic 81.6% |
| Shoshone | 0.0 /100 | #321 | Tragic 81.6% |
| Kiowa | 0.0 /100 | #322 | Tragic 81.6% |
| Alaska Natives | 0.0 /100 | #323 | Tragic 81.6% |