Immigrants from Japan vs Immigrants from Congo In Labor Force | Age 16-19
COMPARE
Immigrants from Japan
Immigrants from Congo
In Labor Force | Age 16-19
In Labor Force | Age 16-19 Comparison
Immigrants from Japan
Immigrants from Congo
34.7%
IN LABOR FORCE | AGE 16-19
1.5/ 100
METRIC RATING
253rd/ 347
METRIC RANK
41.7%
IN LABOR FORCE | AGE 16-19
100.0/ 100
METRIC RATING
37th/ 347
METRIC RANK
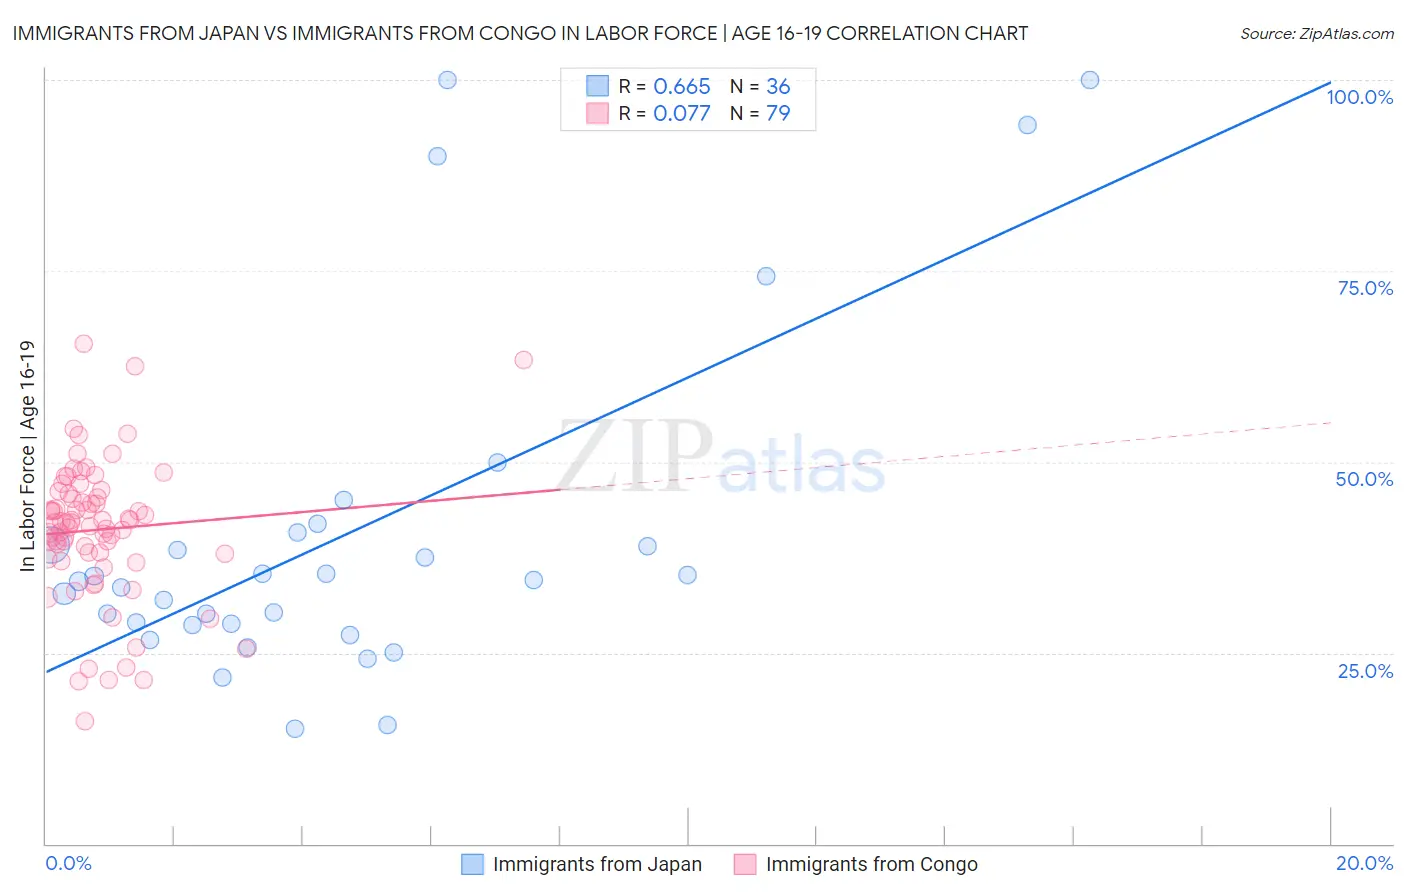
Immigrants from Japan vs Immigrants from Congo In Labor Force | Age 16-19 Correlation Chart
The statistical analysis conducted on geographies consisting of 339,742,908 people shows a significant positive correlation between the proportion of Immigrants from Japan and labor force participation rate among population between the ages 16 and 19 in the United States with a correlation coefficient (R) of 0.665 and weighted average of 34.7%. Similarly, the statistical analysis conducted on geographies consisting of 92,123,036 people shows a slight positive correlation between the proportion of Immigrants from Congo and labor force participation rate among population between the ages 16 and 19 in the United States with a correlation coefficient (R) of 0.077 and weighted average of 41.7%, a difference of 20.3%.
In Labor Force | Age 16-19 Correlation Summary
| Measurement | Immigrants from Japan | Immigrants from Congo |
| Minimum | 15.0% | 16.1% |
| Maximum | 100.0% | 65.5% |
| Range | 85.0% | 49.4% |
| Mean | 40.4% | 41.1% |
| Median | 34.4% | 42.1% |
| Interquartile 25% (IQ1) | 28.7% | 37.9% |
| Interquartile 75% (IQ3) | 39.9% | 45.9% |
| Interquartile Range (IQR) | 11.2% | 8.0% |
| Standard Deviation (Sample) | 22.4% | 9.1% |
| Standard Deviation (Population) | 22.0% | 9.1% |
Similar Demographics by In Labor Force | Age 16-19
Demographics Similar to Immigrants from Japan by In Labor Force | Age 16-19
In terms of in labor force | age 16-19, the demographic groups most similar to Immigrants from Japan are Bahamian (34.6%, a difference of 0.12%), Peruvian (34.6%, a difference of 0.16%), Immigrants from South Central Asia (34.6%, a difference of 0.26%), Immigrants from Egypt (34.6%, a difference of 0.27%), and Thai (34.6%, a difference of 0.28%).
| Demographics | Rating | Rank | In Labor Force | Age 16-19 |
| Immigrants | Sri Lanka | 2.4 /100 | #246 | Tragic 34.9% |
| Laotians | 2.4 /100 | #247 | Tragic 34.9% |
| Central Americans | 2.2 /100 | #248 | Tragic 34.8% |
| Immigrants | Ukraine | 2.2 /100 | #249 | Tragic 34.8% |
| Immigrants | Pakistan | 2.0 /100 | #250 | Tragic 34.8% |
| Immigrants | Western Asia | 2.0 /100 | #251 | Tragic 34.8% |
| Immigrants | Chile | 2.0 /100 | #252 | Tragic 34.8% |
| Immigrants | Japan | 1.5 /100 | #253 | Tragic 34.7% |
| Bahamians | 1.4 /100 | #254 | Tragic 34.6% |
| Peruvians | 1.4 /100 | #255 | Tragic 34.6% |
| Immigrants | South Central Asia | 1.3 /100 | #256 | Tragic 34.6% |
| Immigrants | Egypt | 1.2 /100 | #257 | Tragic 34.6% |
| Thais | 1.2 /100 | #258 | Tragic 34.6% |
| Immigrants | Immigrants | 1.2 /100 | #259 | Tragic 34.6% |
| Egyptians | 1.2 /100 | #260 | Tragic 34.5% |
Demographics Similar to Immigrants from Congo by In Labor Force | Age 16-19
In terms of in labor force | age 16-19, the demographic groups most similar to Immigrants from Congo are Immigrants from the Azores (41.7%, a difference of 0.080%), Yugoslavian (41.8%, a difference of 0.22%), Immigrants from Bosnia and Herzegovina (41.8%, a difference of 0.24%), Liberian (41.8%, a difference of 0.32%), and Sioux (41.5%, a difference of 0.35%).
| Demographics | Rating | Rank | In Labor Force | Age 16-19 |
| Scottish | 100.0 /100 | #30 | Exceptional 42.0% |
| Irish | 100.0 /100 | #31 | Exceptional 42.0% |
| Czechoslovakians | 100.0 /100 | #32 | Exceptional 41.9% |
| Liberians | 100.0 /100 | #33 | Exceptional 41.8% |
| Immigrants | Bosnia and Herzegovina | 100.0 /100 | #34 | Exceptional 41.8% |
| Yugoslavians | 100.0 /100 | #35 | Exceptional 41.8% |
| Immigrants | Azores | 100.0 /100 | #36 | Exceptional 41.7% |
| Immigrants | Congo | 100.0 /100 | #37 | Exceptional 41.7% |
| Sioux | 100.0 /100 | #38 | Exceptional 41.5% |
| Scotch-Irish | 100.0 /100 | #39 | Exceptional 41.5% |
| Immigrants | Liberia | 100.0 /100 | #40 | Exceptional 41.5% |
| Celtics | 100.0 /100 | #41 | Exceptional 41.3% |
| Whites/Caucasians | 100.0 /100 | #42 | Exceptional 41.3% |
| Tongans | 100.0 /100 | #43 | Exceptional 41.2% |
| Europeans | 100.0 /100 | #44 | Exceptional 41.1% |