Immigrants from Japan vs Arab In Labor Force | Age 16-19
COMPARE
Immigrants from Japan
Arab
In Labor Force | Age 16-19
In Labor Force | Age 16-19 Comparison
Immigrants from Japan
Arabs
34.7%
IN LABOR FORCE | AGE 16-19
1.5/ 100
METRIC RATING
253rd/ 347
METRIC RANK
36.8%
IN LABOR FORCE | AGE 16-19
63.6/ 100
METRIC RATING
167th/ 347
METRIC RANK
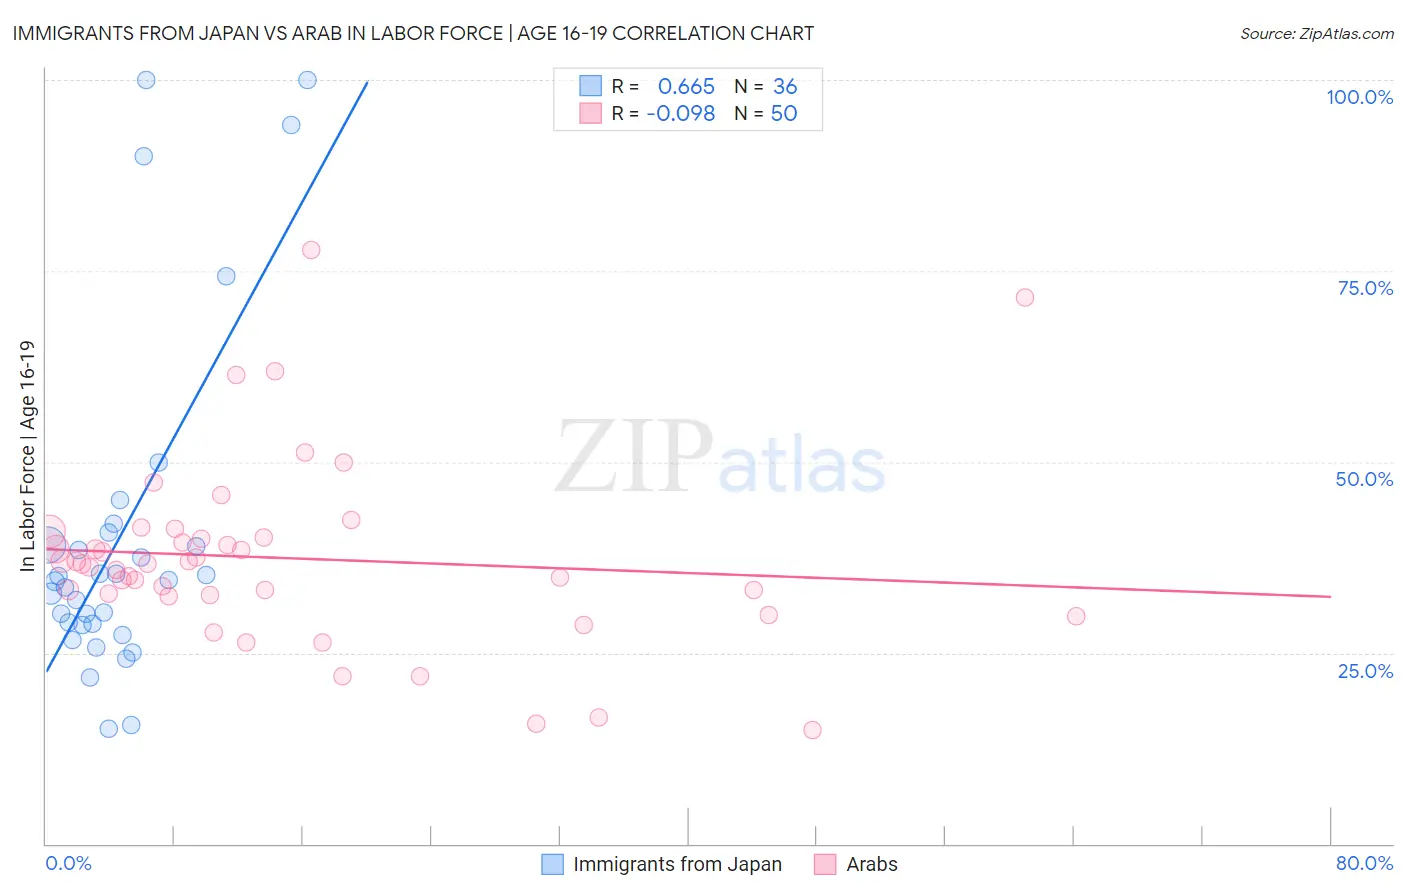
Immigrants from Japan vs Arab In Labor Force | Age 16-19 Correlation Chart
The statistical analysis conducted on geographies consisting of 339,742,908 people shows a significant positive correlation between the proportion of Immigrants from Japan and labor force participation rate among population between the ages 16 and 19 in the United States with a correlation coefficient (R) of 0.665 and weighted average of 34.7%. Similarly, the statistical analysis conducted on geographies consisting of 485,752,171 people shows a slight negative correlation between the proportion of Arabs and labor force participation rate among population between the ages 16 and 19 in the United States with a correlation coefficient (R) of -0.098 and weighted average of 36.8%, a difference of 6.3%.
In Labor Force | Age 16-19 Correlation Summary
| Measurement | Immigrants from Japan | Arab |
| Minimum | 15.0% | 14.9% |
| Maximum | 100.0% | 77.8% |
| Range | 85.0% | 62.9% |
| Mean | 40.4% | 37.4% |
| Median | 34.4% | 36.7% |
| Interquartile 25% (IQ1) | 28.7% | 32.6% |
| Interquartile 75% (IQ3) | 39.9% | 40.1% |
| Interquartile Range (IQR) | 11.2% | 7.5% |
| Standard Deviation (Sample) | 22.4% | 12.1% |
| Standard Deviation (Population) | 22.0% | 12.0% |
Similar Demographics by In Labor Force | Age 16-19
Demographics Similar to Immigrants from Japan by In Labor Force | Age 16-19
In terms of in labor force | age 16-19, the demographic groups most similar to Immigrants from Japan are Bahamian (34.6%, a difference of 0.12%), Peruvian (34.6%, a difference of 0.16%), Immigrants from South Central Asia (34.6%, a difference of 0.26%), Immigrants from Egypt (34.6%, a difference of 0.27%), and Thai (34.6%, a difference of 0.28%).
| Demographics | Rating | Rank | In Labor Force | Age 16-19 |
| Immigrants | Sri Lanka | 2.4 /100 | #246 | Tragic 34.9% |
| Laotians | 2.4 /100 | #247 | Tragic 34.9% |
| Central Americans | 2.2 /100 | #248 | Tragic 34.8% |
| Immigrants | Ukraine | 2.2 /100 | #249 | Tragic 34.8% |
| Immigrants | Pakistan | 2.0 /100 | #250 | Tragic 34.8% |
| Immigrants | Western Asia | 2.0 /100 | #251 | Tragic 34.8% |
| Immigrants | Chile | 2.0 /100 | #252 | Tragic 34.8% |
| Immigrants | Japan | 1.5 /100 | #253 | Tragic 34.7% |
| Bahamians | 1.4 /100 | #254 | Tragic 34.6% |
| Peruvians | 1.4 /100 | #255 | Tragic 34.6% |
| Immigrants | South Central Asia | 1.3 /100 | #256 | Tragic 34.6% |
| Immigrants | Egypt | 1.2 /100 | #257 | Tragic 34.6% |
| Thais | 1.2 /100 | #258 | Tragic 34.6% |
| Immigrants | Immigrants | 1.2 /100 | #259 | Tragic 34.6% |
| Egyptians | 1.2 /100 | #260 | Tragic 34.5% |
Demographics Similar to Arabs by In Labor Force | Age 16-19
In terms of in labor force | age 16-19, the demographic groups most similar to Arabs are Palestinian (36.8%, a difference of 0.030%), Immigrants from Latvia (36.8%, a difference of 0.11%), Immigrants from Western Africa (36.9%, a difference of 0.17%), Immigrants from South Africa (36.8%, a difference of 0.17%), and Yakama (36.9%, a difference of 0.18%).
| Demographics | Rating | Rank | In Labor Force | Age 16-19 |
| Immigrants | Saudi Arabia | 73.9 /100 | #160 | Good 37.0% |
| Cambodians | 71.5 /100 | #161 | Good 37.0% |
| Immigrants | Jordan | 69.5 /100 | #162 | Good 36.9% |
| Bermudans | 69.3 /100 | #163 | Good 36.9% |
| Immigrants | Kuwait | 68.9 /100 | #164 | Good 36.9% |
| Yakama | 66.9 /100 | #165 | Good 36.9% |
| Immigrants | Western Africa | 66.7 /100 | #166 | Good 36.9% |
| Arabs | 63.6 /100 | #167 | Good 36.8% |
| Palestinians | 63.1 /100 | #168 | Good 36.8% |
| Immigrants | Latvia | 61.6 /100 | #169 | Good 36.8% |
| Immigrants | South Africa | 60.5 /100 | #170 | Good 36.8% |
| Immigrants | Cambodia | 58.4 /100 | #171 | Average 36.7% |
| South Africans | 58.3 /100 | #172 | Average 36.7% |
| Russians | 57.5 /100 | #173 | Average 36.7% |
| Immigrants | Czechoslovakia | 50.0 /100 | #174 | Average 36.6% |