Immigrants from Jamaica vs Immigrants from Germany In Labor Force | Age 35-44

COMPARE

Immigrants from Jamaica
Race
Ancestry
AfghanAfricanAlaska NativeAlaskan AthabascanAlbanianAleutAlsatianAmericanApacheArabArapahoArgentineanArmenianAssyrian/Chaldean/SyriacAustralianAustrianBahamianBangladeshiBarbadianBasqueBelgianBelizeanBermudanBhutaneseBlackfeetBolivianBrazilianBritishBritish West IndianBulgarianBurmeseCajunCambodianCanadianCape VerdeanCarpatho RusynCelticCentral AmericanCentral American IndianCherokeeCheyenneChickasawChileanChineseChippewaChoctawColombianColvilleComancheCosta RicanCreeCreekCroatianCrowCubanCypriotCzechCzechoslovakianDanishDelawareDominicanDutchDutch West IndianEastern EuropeanEcuadorianEgyptianEnglishEstonianEthiopianEuropeanFijianFilipinoFinnishFrenchFrench American IndianFrench CanadianGermanGerman RussianGhanaianGreekGuamanian/ChamorroGuatemalanGuyaneseHaitianHmongHonduranHopiHoumaHungarianIcelanderIndian (Asian)IndonesianInupiatIranianIraqiIrishIroquoisIsraeliItalianJamaicanJapaneseJordanianKenyanKiowaKoreanLaotianLatvianLebaneseLiberianLithuanianLumbeeLuxembourgerMacedonianMalaysianMalteseMarshalleseMenomineeMexicanMexican American IndianMongolianMoroccanNative HawaiianNavajoNepaleseNew ZealanderNicaraguanNigerianNorthern EuropeanNorwegianOkinawanOsageOttawaPaiutePakistaniPalestinianPanamanianParaguayanPennsylvania GermanPeruvianPimaPolishPortuguesePotawatomiPuebloPuerto RicanPuget Sound SalishRomanianRussianSalvadoranSamoanScandinavianScotch-IrishScottishSeminoleSenegaleseSerbianShoshoneSierra LeoneanSiouxSlavicSlovakSloveneSomaliSouth AfricanSouth AmericanSouth American IndianSoviet UnionSpaniardSpanishSpanish AmericanSpanish American IndianSri LankanSubsaharan AfricanSudaneseSwedishSwissSyrianTaiwaneseThaiTlingit-HaidaTohono O'OdhamTonganTrinidadian and TobagonianTsimshianTurkishU.S. Virgin IslanderUgandanUkrainianUruguayanUteVenezuelanVietnameseWelshWest IndianYakamaYaquiYugoslavianYumanYup'ikZimbabwean
Immigration
NonimmigrantsImmigrantsAfghanistanAfricaAlbaniaArgentinaArmeniaAsiaAustraliaAustriaBahamasBangladeshBarbadosBelarusBelgiumBelizeBoliviaBosnia and HerzegovinaBrazilBulgariaBurma/MyanmarCabo VerdeCambodiaCameroonCanadaCaribbeanCentral AmericaChileChinaColombiaCongoCosta RicaCroatiaCubaCzechoslovakiaDenmarkDominicaDominican RepublicEastern AfricaEastern AsiaEastern EuropeEcuadorEgyptEl SalvadorEnglandEritreaEthiopiaEuropeFijiFranceGhanaGreeceGrenadaGuatemalaGuyanaHaitiHondurasHong KongHungaryIndiaIndonesiaIranIraqIrelandIsraelItalyJamaicaJapanJordanKazakhstanKenyaKoreaKuwaitLaosLatin AmericaLatviaLebanonLiberiaLithuaniaMalaysiaMexicoMicronesiaMiddle AfricaMoldovaMoroccoNepalNetherlandsNicaraguaNigeriaNorth AmericaNorth MacedoniaNorthern AfricaNorthern EuropeNorwayOceaniaPakistanPanamaPeruPhilippinesPolandPortugalRomaniaRussiaSaudi ArabiaScotlandSenegalSerbiaSierra LeoneSingaporeSomaliaSouth AfricaSouth AmericaSouth Central AsiaSouth Eastern AsiaSouthern EuropeSpainSri LankaSt. Vincent and the GrenadinesSudanSwedenSwitzerlandSyriaTaiwanThailandTrinidad and TobagoTurkeyUgandaUkraineUruguayUzbekistanVenezuelaVietnamWest IndiesWestern AfricaWestern AsiaWestern EuropeYemenZaireZimbabweAzores
Immigrants from Germany
Race
Ancestry
AfghanAfricanAlaska NativeAlaskan AthabascanAlbanianAleutAlsatianAmericanApacheArabArapahoArgentineanArmenianAssyrian/Chaldean/SyriacAustralianAustrianBahamianBangladeshiBarbadianBasqueBelgianBelizeanBermudanBhutaneseBlackfeetBolivianBrazilianBritishBritish West IndianBulgarianBurmeseCajunCambodianCanadianCape VerdeanCarpatho RusynCelticCentral AmericanCentral American IndianCherokeeCheyenneChickasawChileanChineseChippewaChoctawColombianColvilleComancheCosta RicanCreeCreekCroatianCrowCubanCypriotCzechCzechoslovakianDanishDelawareDominicanDutchDutch West IndianEastern EuropeanEcuadorianEgyptianEnglishEstonianEthiopianEuropeanFijianFilipinoFinnishFrenchFrench American IndianFrench CanadianGermanGerman RussianGhanaianGreekGuamanian/ChamorroGuatemalanGuyaneseHaitianHmongHonduranHopiHoumaHungarianIcelanderIndian (Asian)IndonesianInupiatIranianIraqiIrishIroquoisIsraeliItalianJamaicanJapaneseJordanianKenyanKiowaKoreanLaotianLatvianLebaneseLiberianLithuanianLumbeeLuxembourgerMacedonianMalaysianMalteseMarshalleseMenomineeMexicanMexican American IndianMongolianMoroccanNative HawaiianNavajoNepaleseNew ZealanderNicaraguanNigerianNorthern EuropeanNorwegianOkinawanOsageOttawaPaiutePakistaniPalestinianPanamanianParaguayanPennsylvania GermanPeruvianPimaPolishPortuguesePotawatomiPuebloPuerto RicanPuget Sound SalishRomanianRussianSalvadoranSamoanScandinavianScotch-IrishScottishSeminoleSenegaleseSerbianShoshoneSierra LeoneanSiouxSlavicSlovakSloveneSomaliSouth AfricanSouth AmericanSouth American IndianSoviet UnionSpaniardSpanishSpanish AmericanSpanish American IndianSri LankanSubsaharan AfricanSudaneseSwedishSwissSyrianTaiwaneseThaiTlingit-HaidaTohono O'OdhamTonganTrinidadian and TobagonianTsimshianTurkishU.S. Virgin IslanderUgandanUkrainianUruguayanUteVenezuelanVietnameseWelshWest IndianYakamaYaquiYugoslavianYumanYup'ikZimbabwean
Immigration
NonimmigrantsImmigrantsAfghanistanAfricaAlbaniaArgentinaArmeniaAsiaAustraliaAustriaBahamasBangladeshBarbadosBelarusBelgiumBelizeBoliviaBosnia and HerzegovinaBrazilBulgariaBurma/MyanmarCabo VerdeCambodiaCameroonCanadaCaribbeanCentral AmericaChileChinaColombiaCongoCosta RicaCroatiaCubaCzechoslovakiaDenmarkDominicaDominican RepublicEastern AfricaEastern AsiaEastern EuropeEcuadorEgyptEl SalvadorEnglandEritreaEthiopiaEuropeFijiFranceGermanyGhanaGreeceGrenadaGuatemalaGuyanaHaitiHondurasHong KongHungaryIndiaIndonesiaIranIraqIrelandIsraelItalyJapanJordanKazakhstanKenyaKoreaKuwaitLaosLatin AmericaLatviaLebanonLiberiaLithuaniaMalaysiaMexicoMicronesiaMiddle AfricaMoldovaMoroccoNepalNetherlandsNicaraguaNigeriaNorth AmericaNorth MacedoniaNorthern AfricaNorthern EuropeNorwayOceaniaPakistanPanamaPeruPhilippinesPolandPortugalRomaniaRussiaSaudi ArabiaScotlandSenegalSerbiaSierra LeoneSingaporeSomaliaSouth AfricaSouth AmericaSouth Central AsiaSouth Eastern AsiaSouthern EuropeSpainSri LankaSt. Vincent and the GrenadinesSudanSwedenSwitzerlandSyriaTaiwanThailandTrinidad and TobagoTurkeyUgandaUkraineUruguayUzbekistanVenezuelaVietnamWest IndiesWestern AfricaWestern AsiaWestern EuropeYemenZaireZimbabweAzores
In Labor Force | Age 35-44
Income
Poverty
Unemployment
Labor Participation
Family Structure
Vehicle Availability
Education Level
Disability

In Labor Force | Age 35-44 Comparison

Immigrants from Jamaica

Immigrants from Germany

Good
Tragic
84.6%
IN LABOR FORCE | AGE 35-44
79.4/ 100
METRIC RATING
144th/ 347
METRIC RANK
83.9%
IN LABOR FORCE | AGE 35-44
2.8/ 100
METRIC RATING
233rd/ 347
METRIC RANK

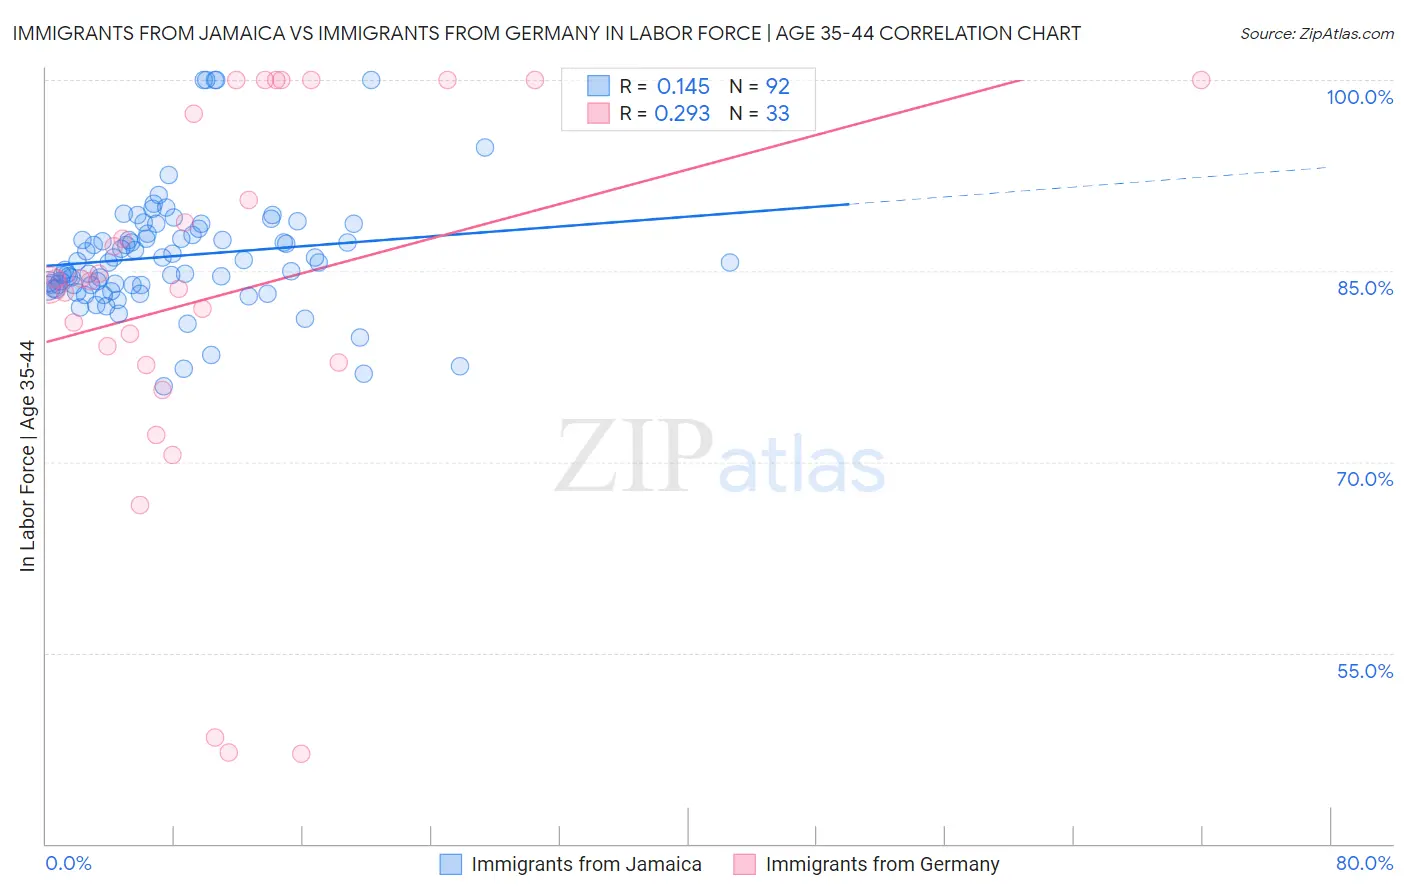
Immigrants from Jamaica vs Immigrants from Germany In Labor Force | Age 35-44 Correlation Chart

The statistical analysis conducted on geographies consisting of 301,667,003 people shows a poor positive correlation between the proportion of Immigrants from Jamaica and labor force participation rate among population between the ages 35 and 44 in the United States with a correlation coefficient (R) of 0.145 and weighted average of 84.6%. Similarly, the statistical analysis conducted on geographies consisting of 463,742,889 people shows a weak positive correlation between the proportion of Immigrants from Germany and labor force participation rate among population between the ages 35 and 44 in the United States with a correlation coefficient (R) of 0.293 and weighted average of 83.9%, a difference of 0.79%.
Immigrants from Jamaica vs Immigrants from Germany In Labor Force | Age 35-44

In Labor Force | Age 35-44 Correlation Summary

MeasurementImmigrants from JamaicaImmigrants from Germany
Minimum75.9%47.1%
Maximum100.0%100.0%
Range24.1%52.9%
Mean86.2%83.2%
Median85.7%84.2%
Interquartile 25% (IQ1)83.7%77.7%
Interquartile 75% (IQ3)87.9%98.7%
Interquartile Range (IQR)4.1%21.0%
Standard Deviation (Sample)4.7%14.9%
Standard Deviation (Population)4.6%14.7%

Similar Demographics by In Labor Force | Age 35-44

Demographics Similar to Immigrants from Jamaica by In Labor Force | Age 35-44

In terms of in labor force | age 35-44, the demographic groups most similar to Immigrants from Jamaica are Immigrants from Ukraine (84.6%, a difference of 0.0%), Immigrants from Saudi Arabia (84.6%, a difference of 0.0%), Immigrants from Belgium (84.6%, a difference of 0.010%), Immigrants from Uruguay (84.6%, a difference of 0.010%), and Immigrants from Asia (84.5%, a difference of 0.010%).
DemographicsRating | RankIn Labor Force | Age 35-44
Immigrants | Chile
84.6
/100
|
#137
Excellent
84.6%
Czechoslovakians
82.6
/100
|
#138
Excellent
84.6%
Immigrants | Zaire
82.5
/100
|
#139
Excellent
84.6%
Immigrants | Japan
81.4
/100
|
#140
Excellent
84.6%
Immigrants | Belgium
80.8
/100
|
#141
Excellent
84.6%
Immigrants | Uruguay
80.1
/100
|
#142
Excellent
84.6%
Immigrants | Ukraine
79.7
/100
|
#143
Good
84.6%
Immigrants | Jamaica
79.4
/100
|
#144
Good
84.6%
Immigrants | Saudi Arabia
79.4
/100
|
#145
Good
84.6%
Immigrants | Asia
78.7
/100
|
#146
Good
84.5%
Immigrants | Netherlands
76.6
/100
|
#147
Good
84.5%
South American Indians
73.6
/100
|
#148
Good
84.5%
Okinawans
73.5
/100
|
#149
Good
84.5%
Immigrants | Nigeria
73.3
/100
|
#150
Good
84.5%
Romanians
72.1
/100
|
#151
Good
84.5%

Demographics Similar to Immigrants from Germany by In Labor Force | Age 35-44

In terms of in labor force | age 35-44, the demographic groups most similar to Immigrants from Germany are Native Hawaiian (83.9%, a difference of 0.010%), Immigrants from Oceania (83.9%, a difference of 0.010%), Scottish (83.9%, a difference of 0.020%), Immigrants from Syria (83.9%, a difference of 0.020%), and West Indian (83.9%, a difference of 0.030%).
DemographicsRating | RankIn Labor Force | Age 35-44
Panamanians
5.4
/100
|
#226
Tragic
84.0%
British West Indians
5.3
/100
|
#227
Tragic
84.0%
Welsh
5.3
/100
|
#228
Tragic
84.0%
Immigrants | Thailand
4.7
/100
|
#229
Tragic
84.0%
Immigrants | Iraq
3.7
/100
|
#230
Tragic
83.9%
Scottish
3.2
/100
|
#231
Tragic
83.9%
Native Hawaiians
3.0
/100
|
#232
Tragic
83.9%
Immigrants | Germany
2.8
/100
|
#233
Tragic
83.9%
Immigrants | Oceania
2.6
/100
|
#234
Tragic
83.9%
Immigrants | Syria
2.5
/100
|
#235
Tragic
83.9%
West Indians
2.4
/100
|
#236
Tragic
83.9%
English
1.8
/100
|
#237
Tragic
83.8%
Immigrants | Laos
1.7
/100
|
#238
Tragic
83.8%
Celtics
1.4
/100
|
#239
Tragic
83.8%
Arabs
1.3
/100
|
#240
Tragic
83.8%