Immigrants from Jamaica vs Subsaharan African 9th Grade
COMPARE
Immigrants from Jamaica
Subsaharan African
9th Grade
9th Grade Comparison
Immigrants from Jamaica
Sub-Saharan Africans
93.9%
9TH GRADE
0.4/ 100
METRIC RATING
262nd/ 347
METRIC RANK
94.4%
9TH GRADE
5.4/ 100
METRIC RATING
226th/ 347
METRIC RANK
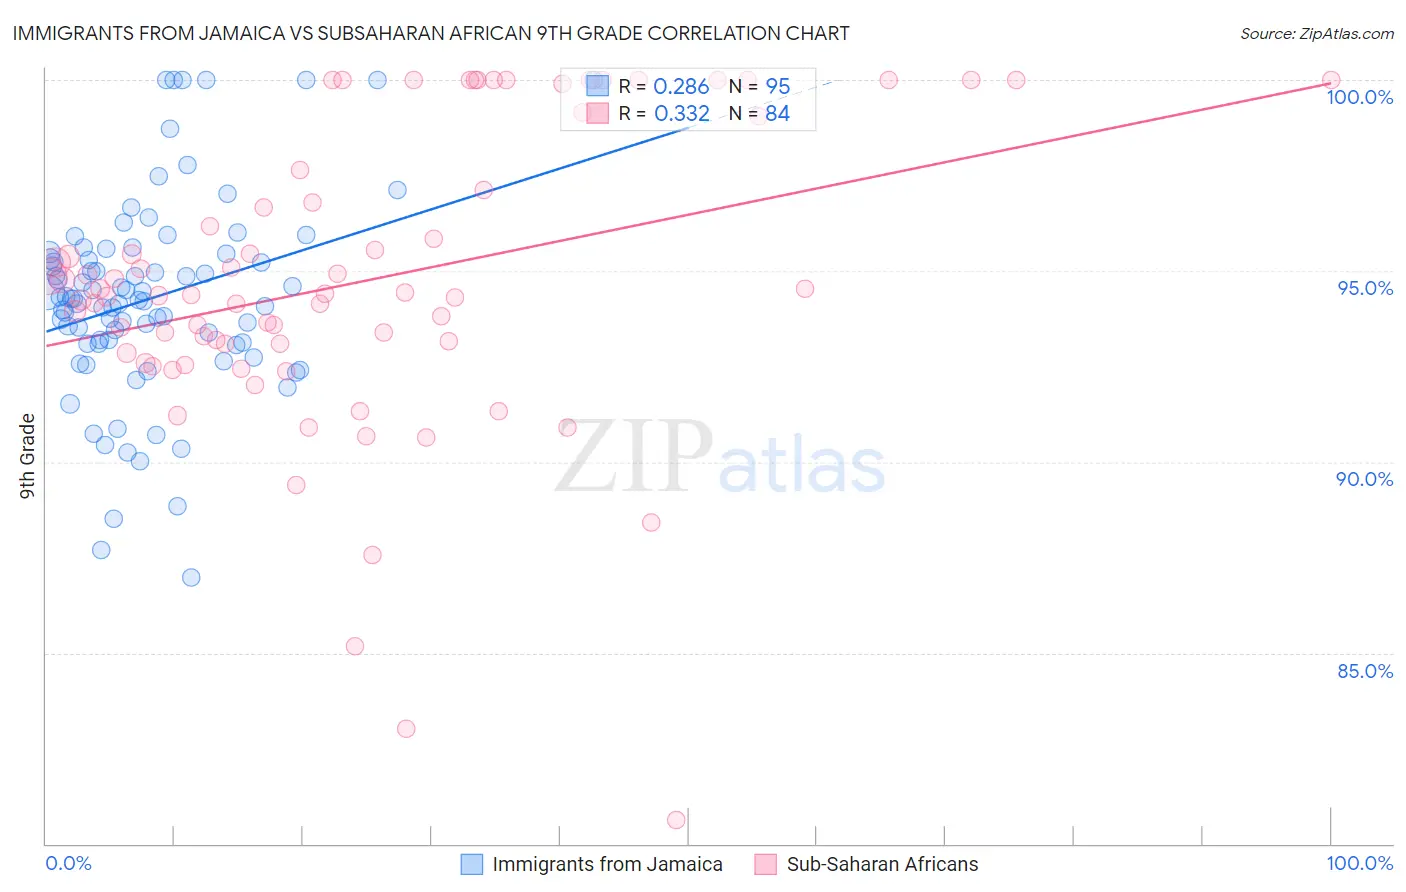
Immigrants from Jamaica vs Subsaharan African 9th Grade Correlation Chart
The statistical analysis conducted on geographies consisting of 301,829,550 people shows a weak positive correlation between the proportion of Immigrants from Jamaica and percentage of population with at least 9th grade education in the United States with a correlation coefficient (R) of 0.286 and weighted average of 93.9%. Similarly, the statistical analysis conducted on geographies consisting of 508,219,008 people shows a mild positive correlation between the proportion of Sub-Saharan Africans and percentage of population with at least 9th grade education in the United States with a correlation coefficient (R) of 0.332 and weighted average of 94.4%, a difference of 0.50%.
9th Grade Correlation Summary
| Measurement | Immigrants from Jamaica | Subsaharan African |
| Minimum | 87.0% | 80.6% |
| Maximum | 100.0% | 100.0% |
| Range | 13.0% | 19.4% |
| Mean | 94.3% | 94.7% |
| Median | 94.3% | 94.4% |
| Interquartile 25% (IQ1) | 93.1% | 93.0% |
| Interquartile 75% (IQ3) | 95.5% | 97.4% |
| Interquartile Range (IQR) | 2.4% | 4.4% |
| Standard Deviation (Sample) | 2.6% | 3.9% |
| Standard Deviation (Population) | 2.6% | 3.9% |
Similar Demographics by 9th Grade
Demographics Similar to Immigrants from Jamaica by 9th Grade
In terms of 9th grade, the demographic groups most similar to Immigrants from Jamaica are Immigrants from Uzbekistan (93.9%, a difference of 0.010%), Immigrants from Congo (93.9%, a difference of 0.010%), Native/Alaskan (93.9%, a difference of 0.010%), Pima (93.9%, a difference of 0.020%), and South American (93.9%, a difference of 0.020%).
| Demographics | Rating | Rank | 9th Grade |
| Immigrants | Nigeria | 0.6 /100 | #255 | Tragic 94.0% |
| Immigrants | Afghanistan | 0.5 /100 | #256 | Tragic 94.0% |
| Immigrants | Costa Rica | 0.5 /100 | #257 | Tragic 94.0% |
| Immigrants | Thailand | 0.5 /100 | #258 | Tragic 93.9% |
| Ghanaians | 0.5 /100 | #259 | Tragic 93.9% |
| Pima | 0.4 /100 | #260 | Tragic 93.9% |
| South Americans | 0.4 /100 | #261 | Tragic 93.9% |
| Immigrants | Jamaica | 0.4 /100 | #262 | Tragic 93.9% |
| Immigrants | Uzbekistan | 0.4 /100 | #263 | Tragic 93.9% |
| Immigrants | Congo | 0.4 /100 | #264 | Tragic 93.9% |
| Natives/Alaskans | 0.4 /100 | #265 | Tragic 93.9% |
| Navajo | 0.3 /100 | #266 | Tragic 93.9% |
| Armenians | 0.3 /100 | #267 | Tragic 93.9% |
| Immigrants | Bolivia | 0.3 /100 | #268 | Tragic 93.9% |
| Immigrants | Uruguay | 0.2 /100 | #269 | Tragic 93.8% |
Demographics Similar to Sub-Saharan Africans by 9th Grade
In terms of 9th grade, the demographic groups most similar to Sub-Saharan Africans are Ethiopian (94.4%, a difference of 0.0%), Tongan (94.4%, a difference of 0.020%), Immigrants from Sierra Leone (94.4%, a difference of 0.020%), Lumbee (94.4%, a difference of 0.030%), and Immigrants from Southern Europe (94.3%, a difference of 0.030%).
| Demographics | Rating | Rank | 9th Grade |
| Africans | 9.0 /100 | #219 | Tragic 94.5% |
| Indians (Asian) | 8.6 /100 | #220 | Tragic 94.5% |
| Immigrants | Eastern Africa | 8.2 /100 | #221 | Tragic 94.5% |
| Immigrants | Asia | 7.7 /100 | #222 | Tragic 94.4% |
| Bahamians | 7.0 /100 | #223 | Tragic 94.4% |
| Tongans | 6.0 /100 | #224 | Tragic 94.4% |
| Ethiopians | 5.4 /100 | #225 | Tragic 94.4% |
| Sub-Saharan Africans | 5.4 /100 | #226 | Tragic 94.4% |
| Immigrants | Sierra Leone | 4.8 /100 | #227 | Tragic 94.4% |
| Lumbee | 4.7 /100 | #228 | Tragic 94.4% |
| Immigrants | Southern Europe | 4.5 /100 | #229 | Tragic 94.3% |
| Apache | 4.2 /100 | #230 | Tragic 94.3% |
| Immigrants | Panama | 4.0 /100 | #231 | Tragic 94.3% |
| Immigrants | Africa | 3.9 /100 | #232 | Tragic 94.3% |
| Nigerians | 3.7 /100 | #233 | Tragic 94.3% |