Guamanian/Chamorro vs Indonesian In Labor Force | Age 20-24
COMPARE
Guamanian/Chamorro
Indonesian
In Labor Force | Age 20-24
In Labor Force | Age 20-24 Comparison
Guamanians/Chamorros
Indonesians
76.7%
IN LABOR FORCE | AGE 20-24
99.8/ 100
METRIC RATING
72nd/ 347
METRIC RANK
77.2%
IN LABOR FORCE | AGE 20-24
100.0/ 100
METRIC RATING
52nd/ 347
METRIC RANK
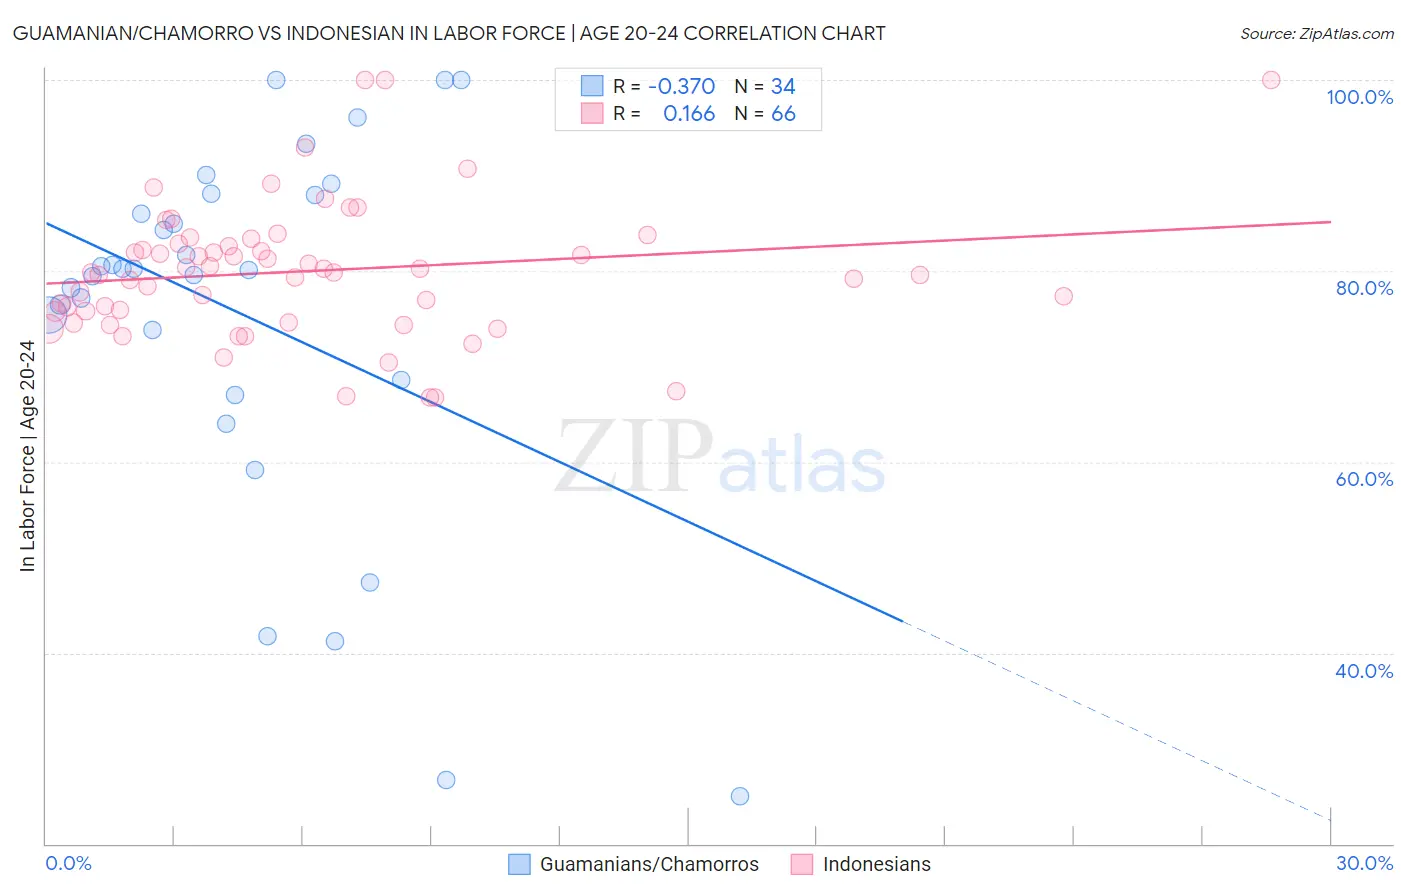
Guamanian/Chamorro vs Indonesian In Labor Force | Age 20-24 Correlation Chart
The statistical analysis conducted on geographies consisting of 221,886,711 people shows a mild negative correlation between the proportion of Guamanians/Chamorros and labor force participation rate among population between the ages 20 and 24 in the United States with a correlation coefficient (R) of -0.370 and weighted average of 76.7%. Similarly, the statistical analysis conducted on geographies consisting of 162,737,934 people shows a poor positive correlation between the proportion of Indonesians and labor force participation rate among population between the ages 20 and 24 in the United States with a correlation coefficient (R) of 0.166 and weighted average of 77.2%, a difference of 0.62%.
In Labor Force | Age 20-24 Correlation Summary
| Measurement | Guamanian/Chamorro | Indonesian |
| Minimum | 25.0% | 66.7% |
| Maximum | 100.0% | 100.0% |
| Range | 75.0% | 33.3% |
| Mean | 75.4% | 80.0% |
| Median | 80.2% | 79.9% |
| Interquartile 25% (IQ1) | 68.6% | 75.7% |
| Interquartile 75% (IQ3) | 88.0% | 82.9% |
| Interquartile Range (IQR) | 19.4% | 7.2% |
| Standard Deviation (Sample) | 19.3% | 7.1% |
| Standard Deviation (Population) | 19.0% | 7.1% |
Demographics Similar to Guamanians/Chamorros and Indonesians by In Labor Force | Age 20-24
In terms of in labor force | age 20-24, the demographic groups most similar to Guamanians/Chamorros are Northern European (76.8%, a difference of 0.030%), Ottawa (76.8%, a difference of 0.10%), Immigrants from Sudan (76.8%, a difference of 0.11%), French American Indian (76.8%, a difference of 0.13%), and Slavic (76.9%, a difference of 0.16%). Similarly, the demographic groups most similar to Indonesians are Immigrants from the Azores (77.2%, a difference of 0.010%), Celtic (77.1%, a difference of 0.15%), Immigrants from Liberia (77.1%, a difference of 0.17%), European (77.1%, a difference of 0.18%), and Chippewa (77.1%, a difference of 0.20%).
| Demographics | Rating | Rank | In Labor Force | Age 20-24 |
| Indonesians | 100.0 /100 | #52 | Exceptional 77.2% |
| Immigrants | Azores | 100.0 /100 | #53 | Exceptional 77.2% |
| Celtics | 99.9 /100 | #54 | Exceptional 77.1% |
| Immigrants | Liberia | 99.9 /100 | #55 | Exceptional 77.1% |
| Europeans | 99.9 /100 | #56 | Exceptional 77.1% |
| Chippewa | 99.9 /100 | #57 | Exceptional 77.1% |
| Hawaiians | 99.9 /100 | #58 | Exceptional 77.0% |
| Scotch-Irish | 99.9 /100 | #59 | Exceptional 77.0% |
| Kenyans | 99.9 /100 | #60 | Exceptional 77.0% |
| Immigrants | Eritrea | 99.9 /100 | #61 | Exceptional 77.0% |
| Immigrants | Kenya | 99.9 /100 | #62 | Exceptional 77.0% |
| Lithuanians | 99.9 /100 | #63 | Exceptional 77.0% |
| Whites/Caucasians | 99.9 /100 | #64 | Exceptional 76.9% |
| Crow | 99.9 /100 | #65 | Exceptional 76.9% |
| Icelanders | 99.9 /100 | #66 | Exceptional 76.9% |
| Slavs | 99.9 /100 | #67 | Exceptional 76.9% |
| French American Indians | 99.8 /100 | #68 | Exceptional 76.8% |
| Immigrants | Sudan | 99.8 /100 | #69 | Exceptional 76.8% |
| Ottawa | 99.8 /100 | #70 | Exceptional 76.8% |
| Northern Europeans | 99.8 /100 | #71 | Exceptional 76.8% |
| Guamanians/Chamorros | 99.8 /100 | #72 | Exceptional 76.7% |