Immigrants from Singapore vs Potawatomi In Labor Force | Age 20-24
COMPARE
Immigrants from Singapore
Potawatomi
In Labor Force | Age 20-24
In Labor Force | Age 20-24 Comparison
Immigrants from Singapore
Potawatomi
72.4%
IN LABOR FORCE | AGE 20-24
0.0/ 100
METRIC RATING
305th/ 347
METRIC RANK
76.2%
IN LABOR FORCE | AGE 20-24
98.5/ 100
METRIC RATING
94th/ 347
METRIC RANK
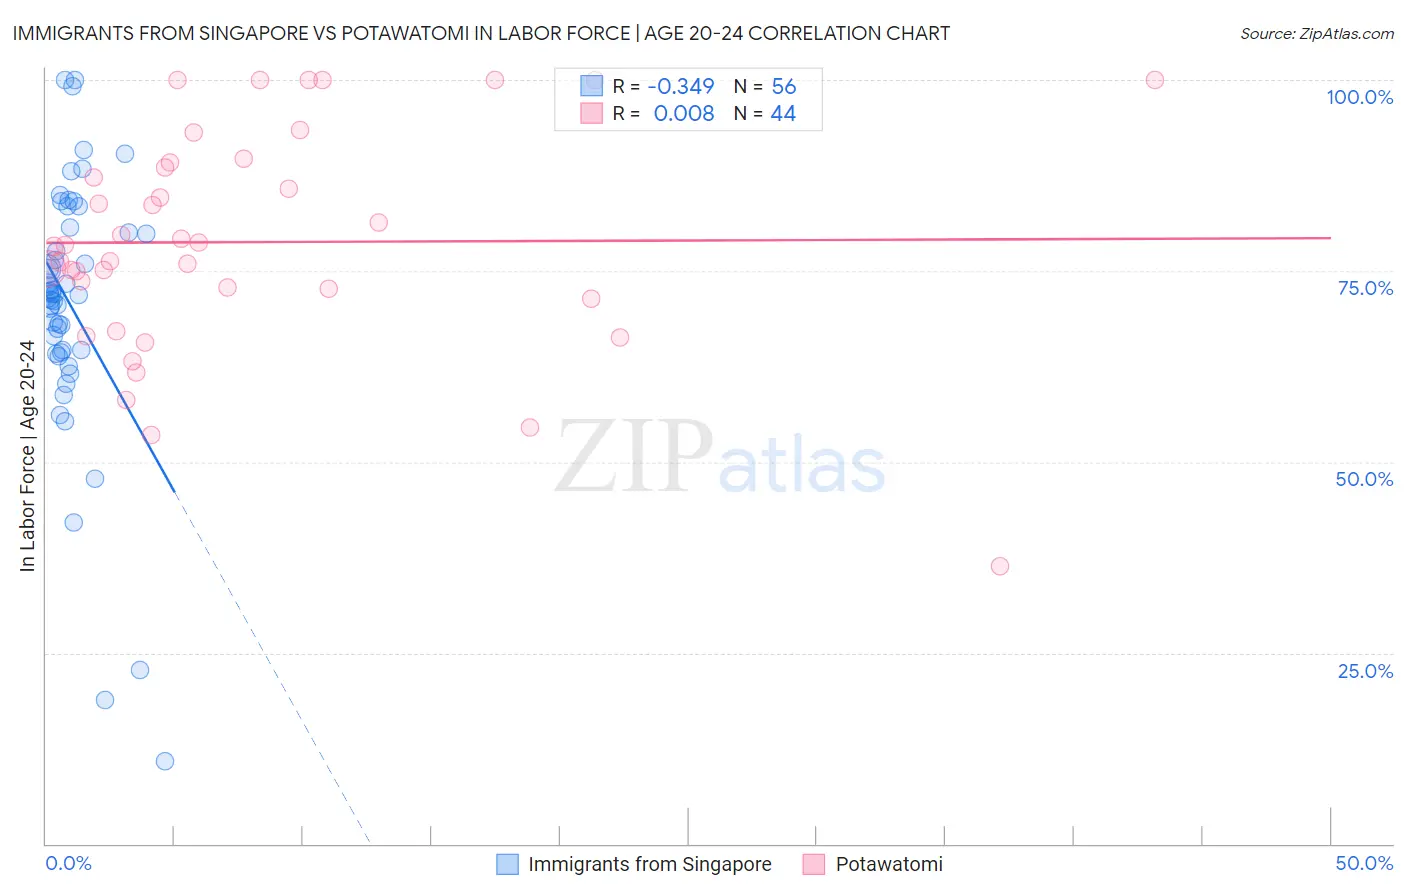
Immigrants from Singapore vs Potawatomi In Labor Force | Age 20-24 Correlation Chart
The statistical analysis conducted on geographies consisting of 137,517,565 people shows a mild negative correlation between the proportion of Immigrants from Singapore and labor force participation rate among population between the ages 20 and 24 in the United States with a correlation coefficient (R) of -0.349 and weighted average of 72.4%. Similarly, the statistical analysis conducted on geographies consisting of 117,717,222 people shows no correlation between the proportion of Potawatomi and labor force participation rate among population between the ages 20 and 24 in the United States with a correlation coefficient (R) of 0.008 and weighted average of 76.2%, a difference of 5.3%.
In Labor Force | Age 20-24 Correlation Summary
| Measurement | Immigrants from Singapore | Potawatomi |
| Minimum | 10.8% | 36.4% |
| Maximum | 100.0% | 100.0% |
| Range | 89.2% | 63.6% |
| Mean | 70.4% | 78.8% |
| Median | 71.9% | 78.3% |
| Interquartile 25% (IQ1) | 64.5% | 72.0% |
| Interquartile 75% (IQ3) | 80.3% | 88.8% |
| Interquartile Range (IQR) | 15.9% | 16.7% |
| Standard Deviation (Sample) | 17.3% | 14.4% |
| Standard Deviation (Population) | 17.2% | 14.2% |
Similar Demographics by In Labor Force | Age 20-24
Demographics Similar to Immigrants from Singapore by In Labor Force | Age 20-24
In terms of in labor force | age 20-24, the demographic groups most similar to Immigrants from Singapore are Immigrants from Jamaica (72.4%, a difference of 0.020%), Immigrants from West Indies (72.4%, a difference of 0.030%), Ecuadorian (72.4%, a difference of 0.040%), Native/Alaskan (72.4%, a difference of 0.050%), and Cuban (72.5%, a difference of 0.14%).
| Demographics | Rating | Rank | In Labor Force | Age 20-24 |
| Israelis | 0.0 /100 | #298 | Tragic 72.6% |
| Iranians | 0.0 /100 | #299 | Tragic 72.6% |
| Armenians | 0.0 /100 | #300 | Tragic 72.5% |
| Cubans | 0.0 /100 | #301 | Tragic 72.5% |
| Natives/Alaskans | 0.0 /100 | #302 | Tragic 72.4% |
| Ecuadorians | 0.0 /100 | #303 | Tragic 72.4% |
| Immigrants | West Indies | 0.0 /100 | #304 | Tragic 72.4% |
| Immigrants | Singapore | 0.0 /100 | #305 | Tragic 72.4% |
| Immigrants | Jamaica | 0.0 /100 | #306 | Tragic 72.4% |
| Immigrants | Ecuador | 0.0 /100 | #307 | Tragic 72.3% |
| Soviet Union | 0.0 /100 | #308 | Tragic 72.3% |
| Tsimshian | 0.0 /100 | #309 | Tragic 72.3% |
| Immigrants | Cuba | 0.0 /100 | #310 | Tragic 72.0% |
| Apache | 0.0 /100 | #311 | Tragic 72.0% |
| Immigrants | Caribbean | 0.0 /100 | #312 | Tragic 71.9% |
Demographics Similar to Potawatomi by In Labor Force | Age 20-24
In terms of in labor force | age 20-24, the demographic groups most similar to Potawatomi are Immigrants from Germany (76.2%, a difference of 0.0%), Nonimmigrants (76.2%, a difference of 0.010%), Hungarian (76.3%, a difference of 0.090%), Maltese (76.3%, a difference of 0.11%), and Immigrants from Lithuania (76.1%, a difference of 0.12%).
| Demographics | Rating | Rank | In Labor Force | Age 20-24 |
| Immigrants | Thailand | 99.3 /100 | #87 | Exceptional 76.4% |
| Spanish | 99.2 /100 | #88 | Exceptional 76.4% |
| Bulgarians | 99.2 /100 | #89 | Exceptional 76.4% |
| Immigrants | Burma/Myanmar | 99.1 /100 | #90 | Exceptional 76.3% |
| Sierra Leoneans | 99.0 /100 | #91 | Exceptional 76.3% |
| Maltese | 98.9 /100 | #92 | Exceptional 76.3% |
| Hungarians | 98.9 /100 | #93 | Exceptional 76.3% |
| Potawatomi | 98.5 /100 | #94 | Exceptional 76.2% |
| Immigrants | Germany | 98.5 /100 | #95 | Exceptional 76.2% |
| Immigrants | Nonimmigrants | 98.5 /100 | #96 | Exceptional 76.2% |
| Immigrants | Lithuania | 98.0 /100 | #97 | Exceptional 76.1% |
| Immigrants | Oceania | 98.0 /100 | #98 | Exceptional 76.1% |
| Americans | 97.8 /100 | #99 | Exceptional 76.1% |
| Shoshone | 97.8 /100 | #100 | Exceptional 76.1% |
| Immigrants | Poland | 97.7 /100 | #101 | Exceptional 76.1% |