Immigrants from Jordan vs Potawatomi In Labor Force | Age 20-24
COMPARE
Immigrants from Jordan
Potawatomi
In Labor Force | Age 20-24
In Labor Force | Age 20-24 Comparison
Immigrants from Jordan
Potawatomi
75.6%
IN LABOR FORCE | AGE 20-24
88.5/ 100
METRIC RATING
131st/ 347
METRIC RANK
76.2%
IN LABOR FORCE | AGE 20-24
98.5/ 100
METRIC RATING
94th/ 347
METRIC RANK
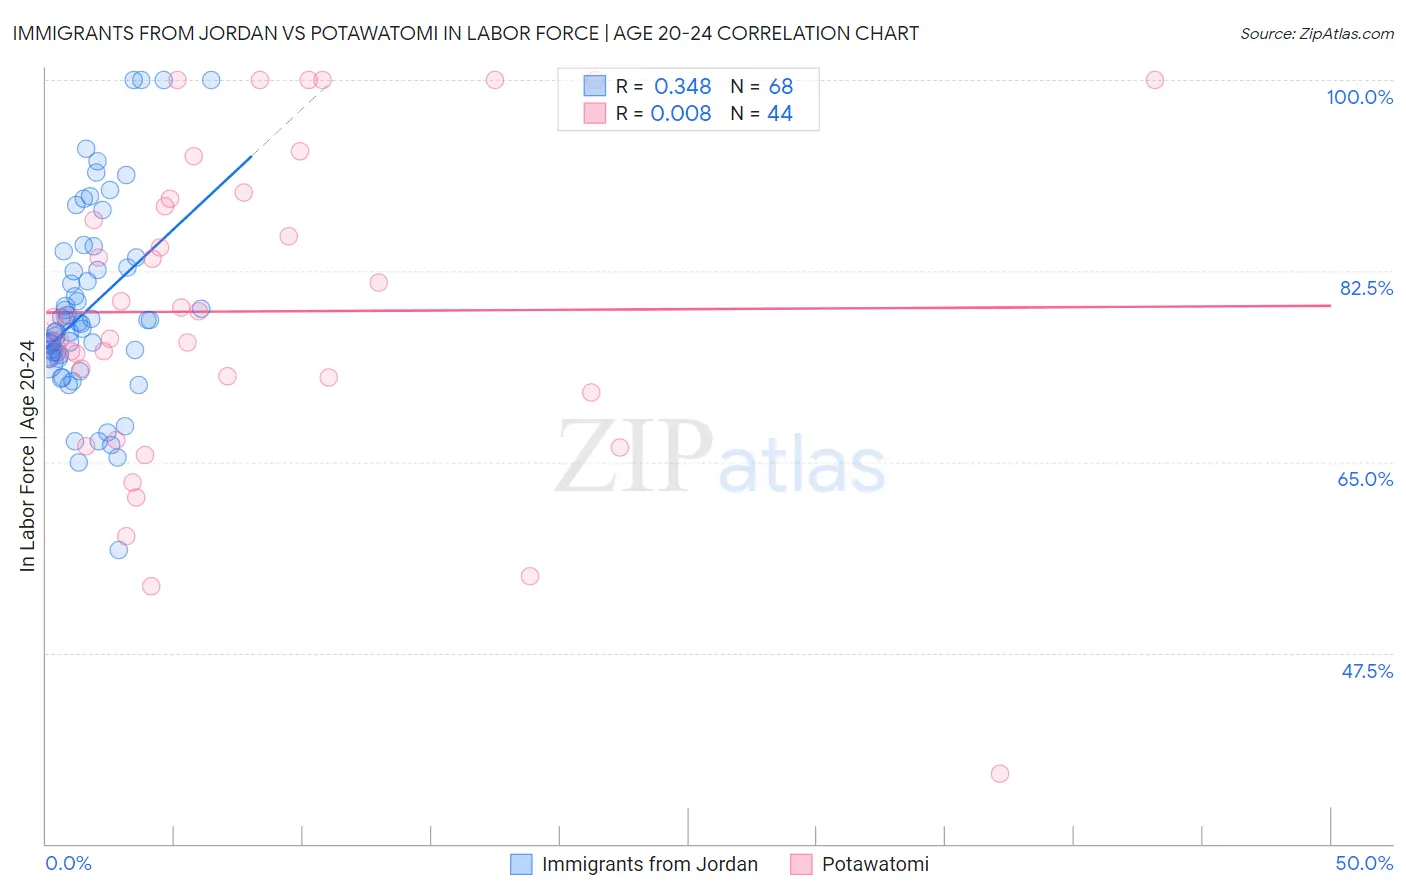
Immigrants from Jordan vs Potawatomi In Labor Force | Age 20-24 Correlation Chart
The statistical analysis conducted on geographies consisting of 181,268,030 people shows a mild positive correlation between the proportion of Immigrants from Jordan and labor force participation rate among population between the ages 20 and 24 in the United States with a correlation coefficient (R) of 0.348 and weighted average of 75.6%. Similarly, the statistical analysis conducted on geographies consisting of 117,717,222 people shows no correlation between the proportion of Potawatomi and labor force participation rate among population between the ages 20 and 24 in the United States with a correlation coefficient (R) of 0.008 and weighted average of 76.2%, a difference of 0.79%.
In Labor Force | Age 20-24 Correlation Summary
| Measurement | Immigrants from Jordan | Potawatomi |
| Minimum | 56.9% | 36.4% |
| Maximum | 100.0% | 100.0% |
| Range | 43.1% | 63.6% |
| Mean | 79.1% | 78.8% |
| Median | 77.7% | 78.3% |
| Interquartile 25% (IQ1) | 74.7% | 72.0% |
| Interquartile 75% (IQ3) | 83.3% | 88.8% |
| Interquartile Range (IQR) | 8.6% | 16.7% |
| Standard Deviation (Sample) | 8.8% | 14.4% |
| Standard Deviation (Population) | 8.7% | 14.2% |
Similar Demographics by In Labor Force | Age 20-24
Demographics Similar to Immigrants from Jordan by In Labor Force | Age 20-24
In terms of in labor force | age 20-24, the demographic groups most similar to Immigrants from Jordan are Palestinian (75.6%, a difference of 0.0%), Immigrants from Austria (75.6%, a difference of 0.010%), Zimbabwean (75.6%, a difference of 0.010%), Iroquois (75.6%, a difference of 0.020%), and Immigrants from Afghanistan (75.6%, a difference of 0.030%).
| Demographics | Rating | Rank | In Labor Force | Age 20-24 |
| Immigrants | Sierra Leone | 93.8 /100 | #124 | Exceptional 75.8% |
| Immigrants | Scotland | 93.7 /100 | #125 | Exceptional 75.8% |
| Brazilians | 93.0 /100 | #126 | Exceptional 75.8% |
| Sub-Saharan Africans | 90.9 /100 | #127 | Exceptional 75.7% |
| Immigrants | Afghanistan | 89.4 /100 | #128 | Excellent 75.6% |
| Iroquois | 89.1 /100 | #129 | Excellent 75.6% |
| Immigrants | Austria | 88.8 /100 | #130 | Excellent 75.6% |
| Immigrants | Jordan | 88.5 /100 | #131 | Excellent 75.6% |
| Palestinians | 88.4 /100 | #132 | Excellent 75.6% |
| Zimbabweans | 88.2 /100 | #133 | Excellent 75.6% |
| Estonians | 87.1 /100 | #134 | Excellent 75.6% |
| Yaqui | 85.5 /100 | #135 | Excellent 75.5% |
| Immigrants | Brazil | 84.8 /100 | #136 | Excellent 75.5% |
| Jordanians | 84.8 /100 | #137 | Excellent 75.5% |
| Australians | 84.8 /100 | #138 | Excellent 75.5% |
Demographics Similar to Potawatomi by In Labor Force | Age 20-24
In terms of in labor force | age 20-24, the demographic groups most similar to Potawatomi are Immigrants from Germany (76.2%, a difference of 0.0%), Nonimmigrants (76.2%, a difference of 0.010%), Hungarian (76.3%, a difference of 0.090%), Maltese (76.3%, a difference of 0.11%), and Immigrants from Lithuania (76.1%, a difference of 0.12%).
| Demographics | Rating | Rank | In Labor Force | Age 20-24 |
| Immigrants | Thailand | 99.3 /100 | #87 | Exceptional 76.4% |
| Spanish | 99.2 /100 | #88 | Exceptional 76.4% |
| Bulgarians | 99.2 /100 | #89 | Exceptional 76.4% |
| Immigrants | Burma/Myanmar | 99.1 /100 | #90 | Exceptional 76.3% |
| Sierra Leoneans | 99.0 /100 | #91 | Exceptional 76.3% |
| Maltese | 98.9 /100 | #92 | Exceptional 76.3% |
| Hungarians | 98.9 /100 | #93 | Exceptional 76.3% |
| Potawatomi | 98.5 /100 | #94 | Exceptional 76.2% |
| Immigrants | Germany | 98.5 /100 | #95 | Exceptional 76.2% |
| Immigrants | Nonimmigrants | 98.5 /100 | #96 | Exceptional 76.2% |
| Immigrants | Lithuania | 98.0 /100 | #97 | Exceptional 76.1% |
| Immigrants | Oceania | 98.0 /100 | #98 | Exceptional 76.1% |
| Americans | 97.8 /100 | #99 | Exceptional 76.1% |
| Shoshone | 97.8 /100 | #100 | Exceptional 76.1% |
| Immigrants | Poland | 97.7 /100 | #101 | Exceptional 76.1% |