Finnish vs Potawatomi In Labor Force | Age 20-24
COMPARE
Finnish
Potawatomi
In Labor Force | Age 20-24
In Labor Force | Age 20-24 Comparison
Finns
Potawatomi
78.7%
IN LABOR FORCE | AGE 20-24
100.0/ 100
METRIC RATING
11th/ 347
METRIC RANK
76.2%
IN LABOR FORCE | AGE 20-24
98.5/ 100
METRIC RATING
94th/ 347
METRIC RANK
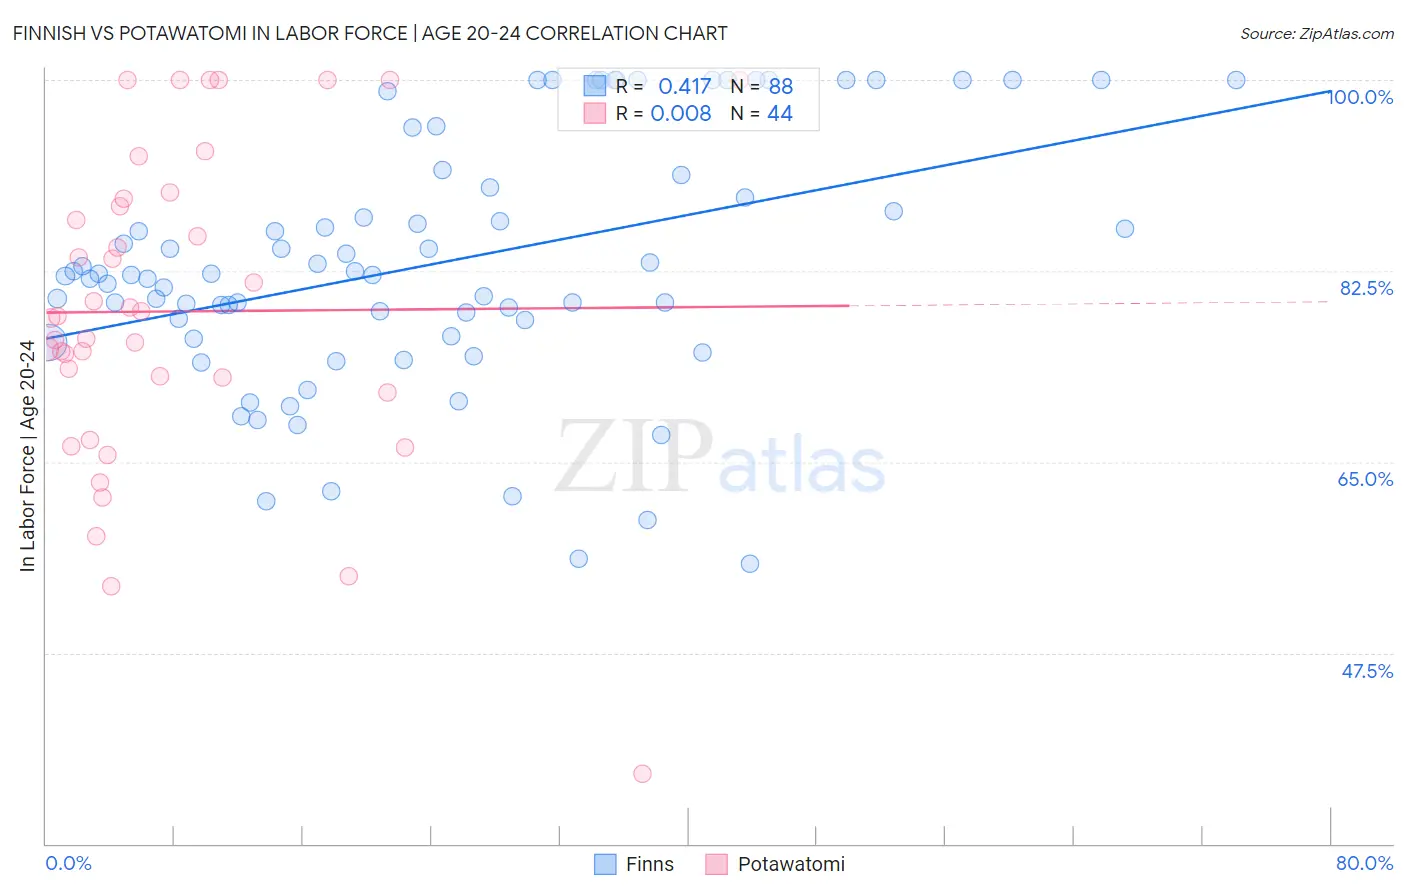
Finnish vs Potawatomi In Labor Force | Age 20-24 Correlation Chart
The statistical analysis conducted on geographies consisting of 404,336,284 people shows a moderate positive correlation between the proportion of Finns and labor force participation rate among population between the ages 20 and 24 in the United States with a correlation coefficient (R) of 0.417 and weighted average of 78.7%. Similarly, the statistical analysis conducted on geographies consisting of 117,717,222 people shows no correlation between the proportion of Potawatomi and labor force participation rate among population between the ages 20 and 24 in the United States with a correlation coefficient (R) of 0.008 and weighted average of 76.2%, a difference of 3.2%.
In Labor Force | Age 20-24 Correlation Summary
| Measurement | Finnish | Potawatomi |
| Minimum | 55.7% | 36.4% |
| Maximum | 100.0% | 100.0% |
| Range | 44.3% | 63.6% |
| Mean | 83.2% | 78.8% |
| Median | 82.2% | 78.3% |
| Interquartile 25% (IQ1) | 77.2% | 72.0% |
| Interquartile 75% (IQ3) | 90.7% | 88.8% |
| Interquartile Range (IQR) | 13.5% | 16.7% |
| Standard Deviation (Sample) | 11.4% | 14.4% |
| Standard Deviation (Population) | 11.4% | 14.2% |
Similar Demographics by In Labor Force | Age 20-24
Demographics Similar to Finns by In Labor Force | Age 20-24
In terms of in labor force | age 20-24, the demographic groups most similar to Finns are Slovene (78.7%, a difference of 0.040%), German (78.6%, a difference of 0.11%), Scandinavian (78.5%, a difference of 0.18%), Swedish (78.8%, a difference of 0.19%), and Czech (78.5%, a difference of 0.19%).
| Demographics | Rating | Rank | In Labor Force | Age 20-24 |
| Alaskan Athabascans | 100.0 /100 | #4 | Exceptional 79.1% |
| Aleuts | 100.0 /100 | #5 | Exceptional 79.0% |
| Danes | 100.0 /100 | #6 | Exceptional 79.0% |
| Luxembourgers | 100.0 /100 | #7 | Exceptional 79.0% |
| Immigrants | Cabo Verde | 100.0 /100 | #8 | Exceptional 78.9% |
| Swedes | 100.0 /100 | #9 | Exceptional 78.8% |
| Slovenes | 100.0 /100 | #10 | Exceptional 78.7% |
| Finns | 100.0 /100 | #11 | Exceptional 78.7% |
| Germans | 100.0 /100 | #12 | Exceptional 78.6% |
| Scandinavians | 100.0 /100 | #13 | Exceptional 78.5% |
| Czechs | 100.0 /100 | #14 | Exceptional 78.5% |
| Sudanese | 100.0 /100 | #15 | Exceptional 78.4% |
| Dutch | 100.0 /100 | #16 | Exceptional 78.4% |
| Cape Verdeans | 100.0 /100 | #17 | Exceptional 78.3% |
| Immigrants | Bosnia and Herzegovina | 100.0 /100 | #18 | Exceptional 78.1% |
Demographics Similar to Potawatomi by In Labor Force | Age 20-24
In terms of in labor force | age 20-24, the demographic groups most similar to Potawatomi are Immigrants from Germany (76.2%, a difference of 0.0%), Nonimmigrants (76.2%, a difference of 0.010%), Hungarian (76.3%, a difference of 0.090%), Maltese (76.3%, a difference of 0.11%), and Immigrants from Lithuania (76.1%, a difference of 0.12%).
| Demographics | Rating | Rank | In Labor Force | Age 20-24 |
| Immigrants | Thailand | 99.3 /100 | #87 | Exceptional 76.4% |
| Spanish | 99.2 /100 | #88 | Exceptional 76.4% |
| Bulgarians | 99.2 /100 | #89 | Exceptional 76.4% |
| Immigrants | Burma/Myanmar | 99.1 /100 | #90 | Exceptional 76.3% |
| Sierra Leoneans | 99.0 /100 | #91 | Exceptional 76.3% |
| Maltese | 98.9 /100 | #92 | Exceptional 76.3% |
| Hungarians | 98.9 /100 | #93 | Exceptional 76.3% |
| Potawatomi | 98.5 /100 | #94 | Exceptional 76.2% |
| Immigrants | Germany | 98.5 /100 | #95 | Exceptional 76.2% |
| Immigrants | Nonimmigrants | 98.5 /100 | #96 | Exceptional 76.2% |
| Immigrants | Lithuania | 98.0 /100 | #97 | Exceptional 76.1% |
| Immigrants | Oceania | 98.0 /100 | #98 | Exceptional 76.1% |
| Americans | 97.8 /100 | #99 | Exceptional 76.1% |
| Shoshone | 97.8 /100 | #100 | Exceptional 76.1% |
| Immigrants | Poland | 97.7 /100 | #101 | Exceptional 76.1% |