Immigrants from Ireland vs Irish In Labor Force | Age > 16
COMPARE
Immigrants from Ireland
Irish
In Labor Force | Age > 16
In Labor Force | Age > 16 Comparison
Immigrants from Ireland
Irish
65.3%
IN LABOR FORCE | AGE > 16
75.9/ 100
METRIC RATING
156th/ 347
METRIC RANK
64.1%
IN LABOR FORCE | AGE > 16
0.4/ 100
METRIC RATING
269th/ 347
METRIC RANK
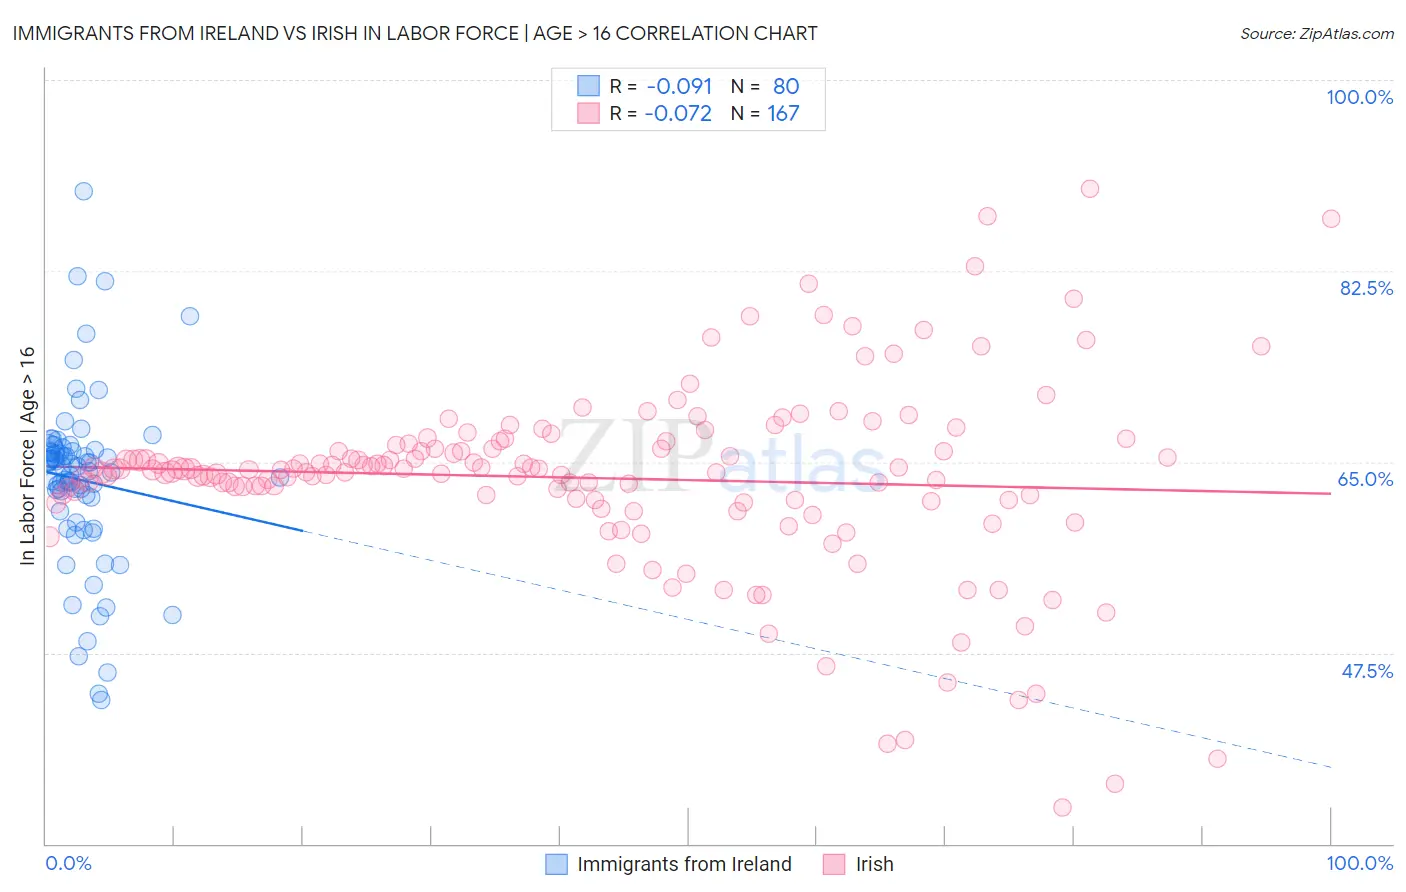
Immigrants from Ireland vs Irish In Labor Force | Age > 16 Correlation Chart
The statistical analysis conducted on geographies consisting of 240,784,168 people shows a slight negative correlation between the proportion of Immigrants from Ireland and labor force participation rate among population ages 16 and over in the United States with a correlation coefficient (R) of -0.091 and weighted average of 65.3%. Similarly, the statistical analysis conducted on geographies consisting of 580,699,794 people shows a slight negative correlation between the proportion of Irish and labor force participation rate among population ages 16 and over in the United States with a correlation coefficient (R) of -0.072 and weighted average of 64.1%, a difference of 1.9%.
In Labor Force | Age > 16 Correlation Summary
| Measurement | Immigrants from Ireland | Irish |
| Minimum | 43.2% | 33.3% |
| Maximum | 89.8% | 90.0% |
| Range | 46.6% | 56.7% |
| Mean | 63.3% | 63.5% |
| Median | 64.4% | 64.3% |
| Interquartile 25% (IQ1) | 61.1% | 61.5% |
| Interquartile 75% (IQ3) | 66.0% | 66.6% |
| Interquartile Range (IQR) | 4.9% | 5.1% |
| Standard Deviation (Sample) | 7.9% | 8.6% |
| Standard Deviation (Population) | 7.8% | 8.6% |
Similar Demographics by In Labor Force | Age > 16
Demographics Similar to Immigrants from Ireland by In Labor Force | Age > 16
In terms of in labor force | age > 16, the demographic groups most similar to Immigrants from Ireland are Immigrants from Russia (65.3%, a difference of 0.0%), Immigrants from Armenia (65.3%, a difference of 0.010%), Panamanian (65.3%, a difference of 0.010%), Immigrants from Syria (65.3%, a difference of 0.020%), and Immigrants from Eastern Europe (65.4%, a difference of 0.040%).
| Demographics | Rating | Rank | In Labor Force | Age > 16 |
| Immigrants | Albania | 85.7 /100 | #149 | Excellent 65.4% |
| Immigrants | Immigrants | 81.9 /100 | #150 | Excellent 65.4% |
| Czechs | 81.5 /100 | #151 | Excellent 65.4% |
| Yugoslavians | 81.3 /100 | #152 | Excellent 65.4% |
| Immigrants | China | 80.5 /100 | #153 | Excellent 65.4% |
| Immigrants | Eastern Europe | 78.3 /100 | #154 | Good 65.4% |
| Immigrants | Armenia | 76.6 /100 | #155 | Good 65.3% |
| Immigrants | Ireland | 75.9 /100 | #156 | Good 65.3% |
| Immigrants | Russia | 75.7 /100 | #157 | Good 65.3% |
| Panamanians | 75.2 /100 | #158 | Good 65.3% |
| Immigrants | Syria | 74.6 /100 | #159 | Good 65.3% |
| Immigrants | South Africa | 73.5 /100 | #160 | Good 65.3% |
| Australians | 71.3 /100 | #161 | Good 65.3% |
| Albanians | 70.8 /100 | #162 | Good 65.3% |
| South Africans | 69.8 /100 | #163 | Good 65.3% |
Demographics Similar to Irish by In Labor Force | Age > 16
In terms of in labor force | age > 16, the demographic groups most similar to Irish are Guyanese (64.1%, a difference of 0.030%), Dominican (64.1%, a difference of 0.030%), Canadian (64.1%, a difference of 0.040%), Spaniard (64.1%, a difference of 0.040%), and Immigrants from England (64.2%, a difference of 0.050%).
| Demographics | Rating | Rank | In Labor Force | Age > 16 |
| Finns | 0.7 /100 | #262 | Tragic 64.2% |
| Bahamians | 0.6 /100 | #263 | Tragic 64.2% |
| Dutch | 0.6 /100 | #264 | Tragic 64.2% |
| Cubans | 0.5 /100 | #265 | Tragic 64.2% |
| Immigrants | England | 0.5 /100 | #266 | Tragic 64.2% |
| Canadians | 0.5 /100 | #267 | Tragic 64.1% |
| Spaniards | 0.5 /100 | #268 | Tragic 64.1% |
| Irish | 0.4 /100 | #269 | Tragic 64.1% |
| Guyanese | 0.4 /100 | #270 | Tragic 64.1% |
| Dominicans | 0.4 /100 | #271 | Tragic 64.1% |
| Native Hawaiians | 0.3 /100 | #272 | Tragic 64.1% |
| Hmong | 0.3 /100 | #273 | Tragic 64.1% |
| Immigrants | Cuba | 0.3 /100 | #274 | Tragic 64.1% |
| Mexicans | 0.3 /100 | #275 | Tragic 64.1% |
| French American Indians | 0.3 /100 | #276 | Tragic 64.1% |